
The Insights tab is available on the Business plan and above. On lower plans the tab still appears, and opening it offers an upgrade. See Plans and billing. Everyone on your team can read it, including Members, because it counts as analytics. See Roles and permissions.
Open the Insights tab
1
Open a post
Go to Feedback and click the post you want to understand.
2
Switch to Insights
In the post header, click Insights next to Discussion.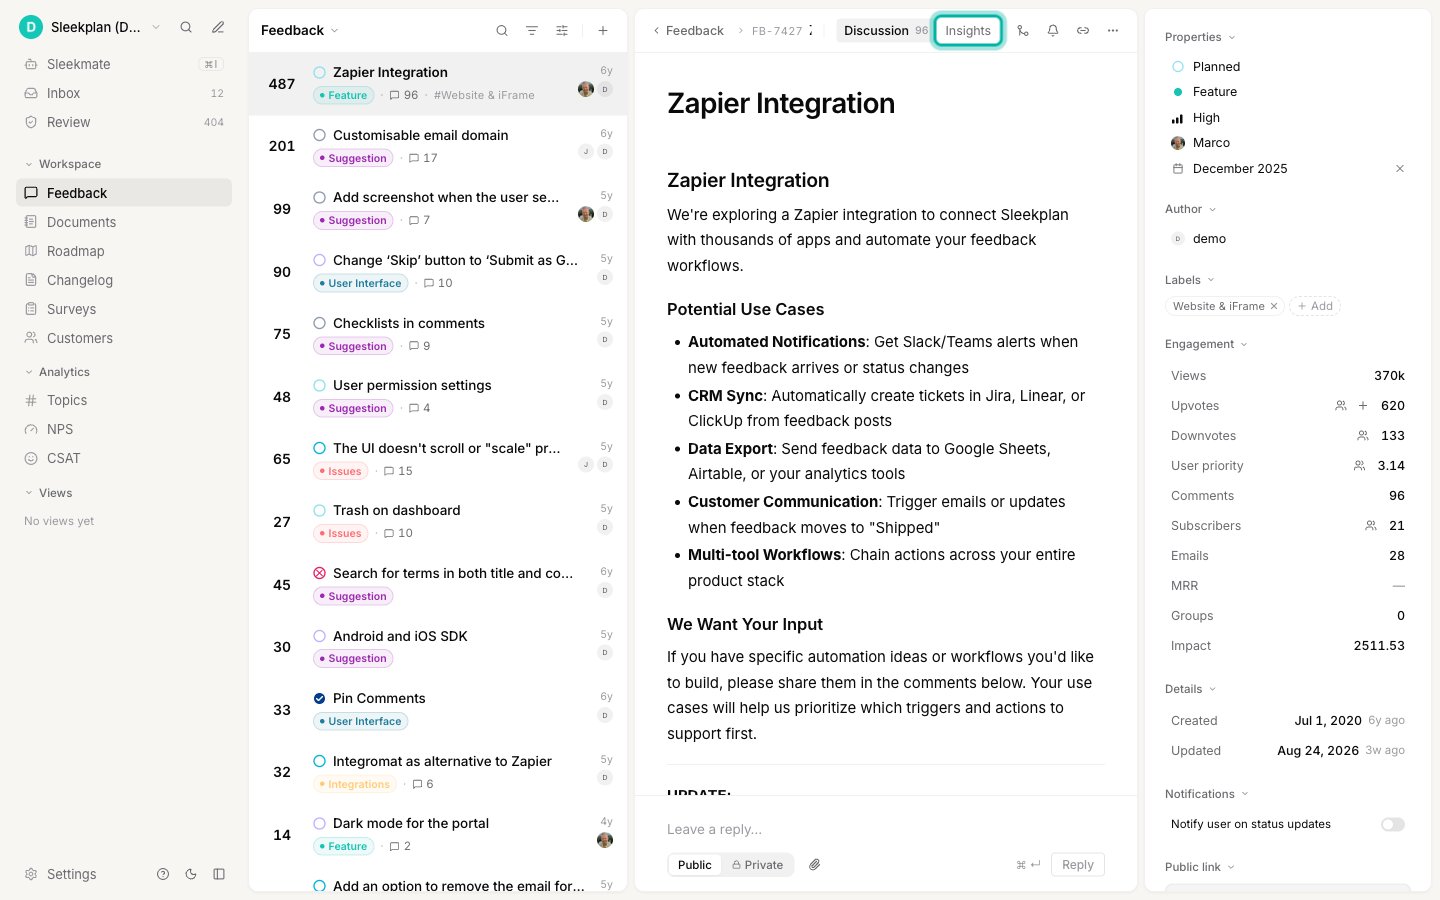
Start with the summary
The first line is a plain-language verdict, written from fixed thresholds and your workspace’s own baselines. It states at most three things: how much demand there is, what the request is worth, and the single loudest risk or signal attached to it (rising or falling votes, urgency, tone, or a status that has not moved).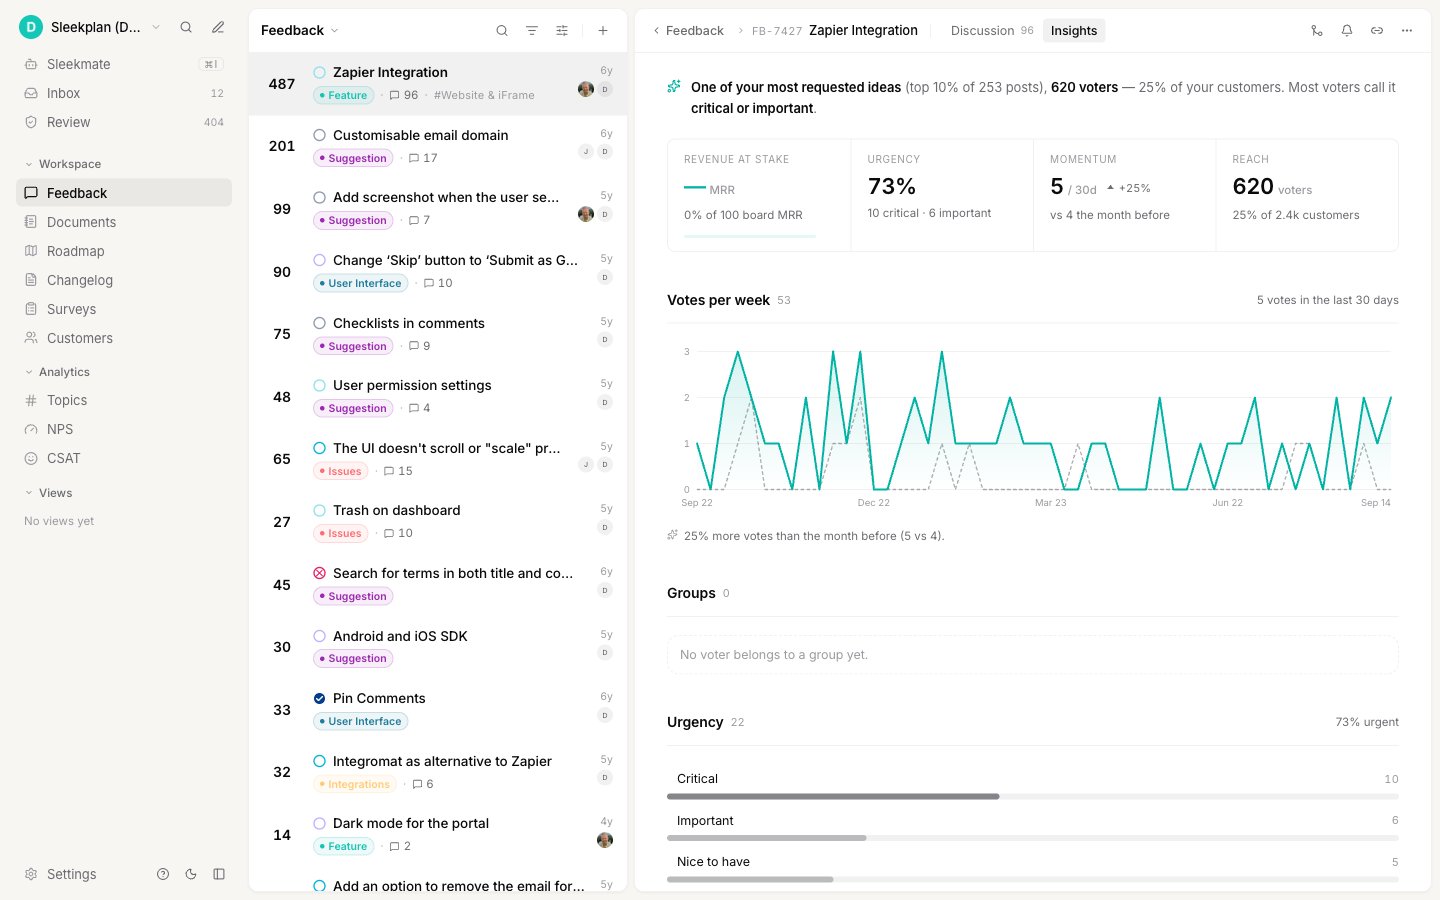
Read the shares, not just the totals. “620 voters” means little on its own; “25% of your customers” settles an argument.
Votes per week
The chart covers the last 52 weeks, one point per week, so you can see whether a request is building, steady, or long dead. When downvotes are enabled and the post has any, they are drawn as a second, dashed line. Vertical guides mark the moments that explain a sudden jump or drop: a status change, and any post merged into this one. A merge hands over the other post’s votes at once, so a spike with a merge marker on it is not a wave of new interest. Hover any week to see the exact counts and what happened that week. Below the chart, a short line compares the last 30 days with the 30 before whenever the change is meaningful.Who is asking
Groups
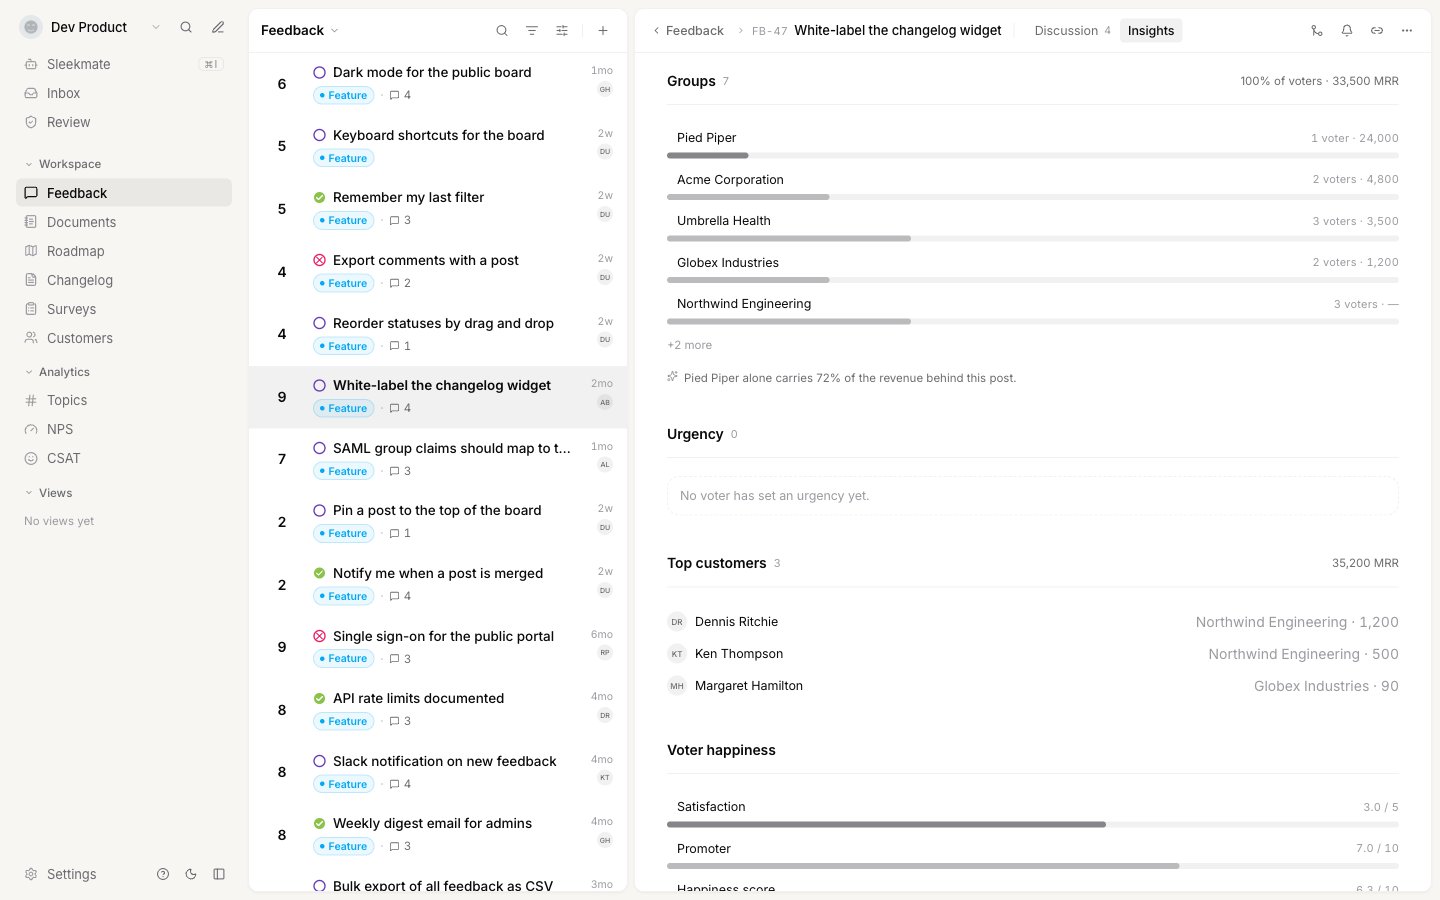
Groups counts the accounts behind the request rather than the individual voters, so five people from one customer count as one customer. It covers every group type in your workspace, not only companies. The header shows how many groups are involved, what share of voters belong to a group at all, and the combined revenue of those groups. Underneath, the five highest-paying groups are listed with their voter count and MRR, and a “+N more” line if there are others. Click any row to open that group’s profile. If nobody’s voters belong to a group, the block says so. Groups are created from the data you send about your users, so this block fills up once your customer identity setup includes a company or account.Top customers
The ten highest-paying voters, with their group, the urgency they picked, and their MRR. Only voters with revenue recorded appear here, sorted by MRR, so this is the list to skim before a renewal conversation. A customer’s MRR comes from their record in Customers, where you can edit it by hand, or from themrr value your single sign-on token carries. See Revenue behind a request for where to record revenue and how the combined figure is built.
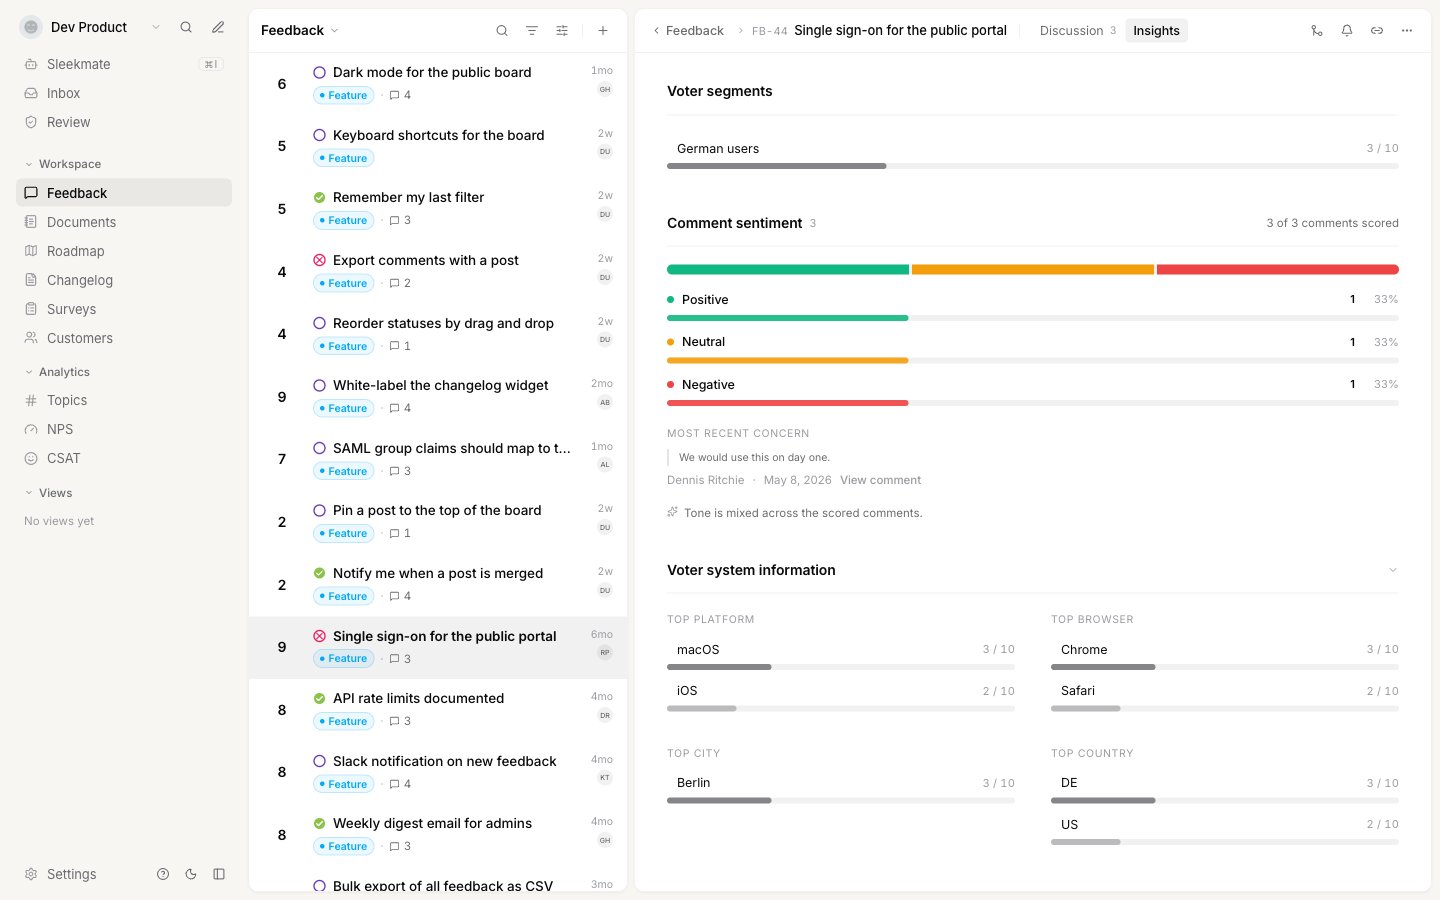
Voter segments
How this post’s voters split across your user segments, showing the voters in each segment against the post’s total. It answers “is this only our enterprise tier asking, or everyone”. Up to ten segments are checked, and a segment with no voters on this post is left out.How much it matters
Urgency
The full spread of urgency levels people chose when they voted, highest first, with the number of voters at each level. When a clear majority sit in the top levels, a line underneath says so in words. This block needs priority voting turned on. Until it is, voters have no way to say how badly they want something, and the block stays empty.Voter happiness
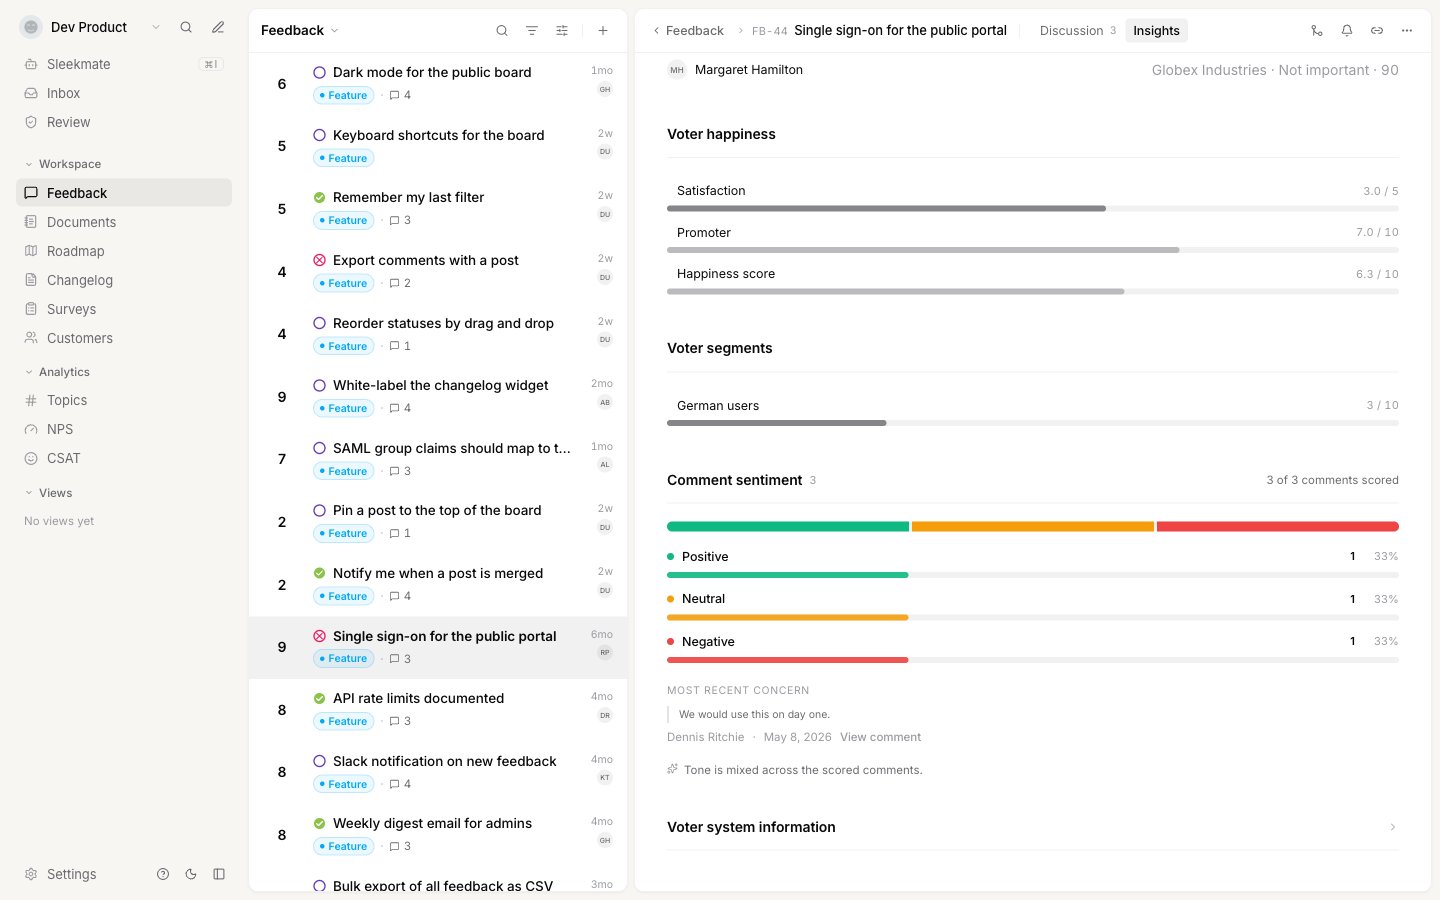
How the people asking for this feel about you overall, averaged across the voters who have answered a survey:- Satisfaction: their average CSAT answer, out of 5.
- Promoter: their average NPS answer, out of 10.
- Happiness score: both combined onto a single 0 to 10 scale, using whichever of the two a customer has answered.
What they are saying
Voter system information
The numbers in the sidebar
Insights is the deep read. A few of the same figures live permanently in the post’s sidebar under Engagement, so you can see them without leaving the discussion: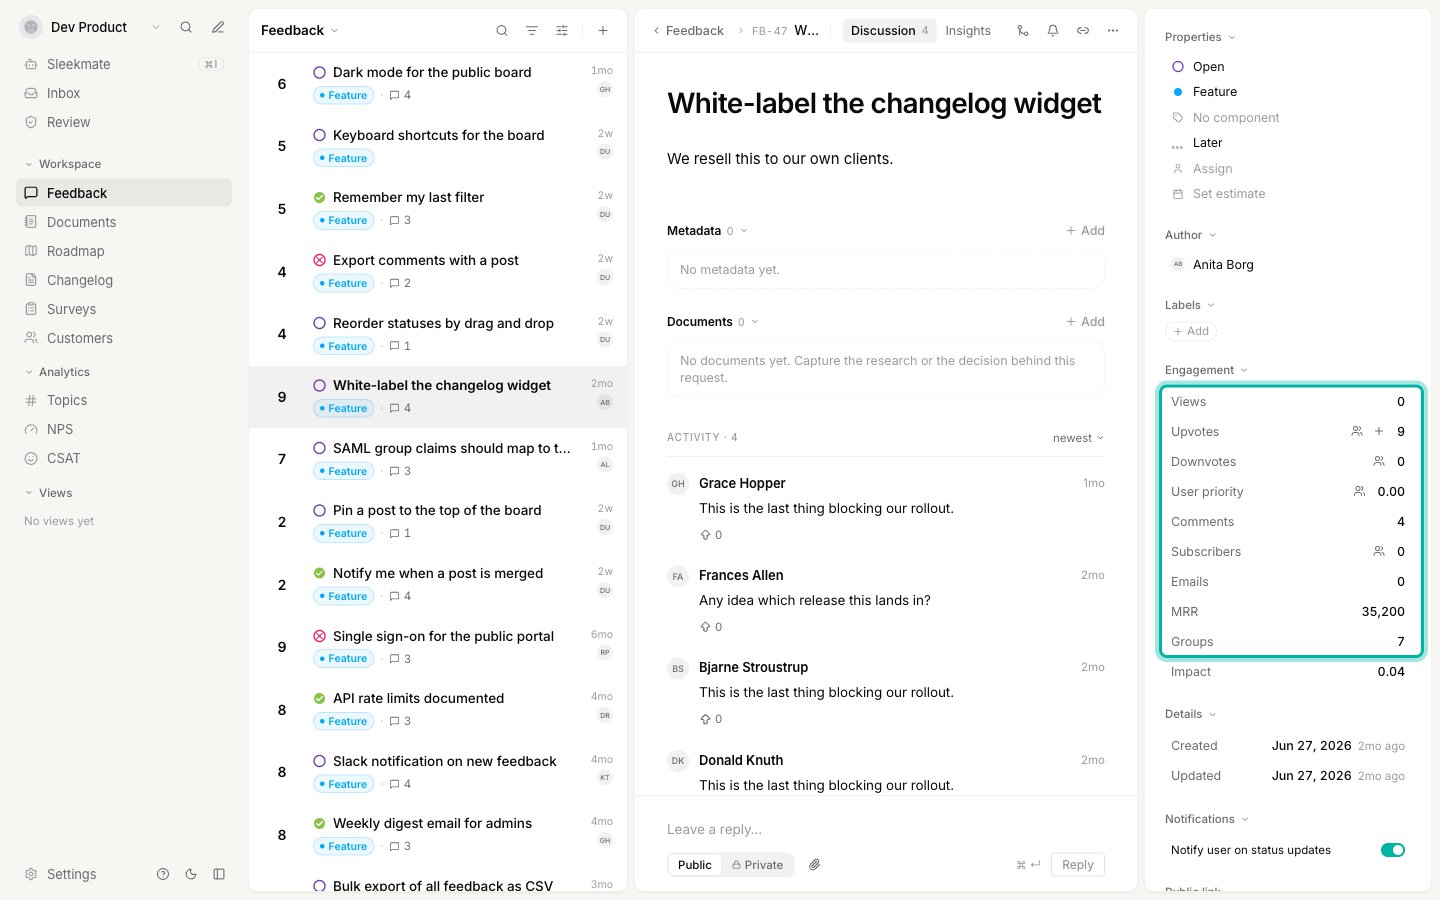
- Views: how many times the post has been opened on your board or widget.
- Emails: how many emails Sleekplan has sent about this post.
- MRR and Groups: the same combined revenue and account count as the Insights tab.
- In status since and Changelog: how long the post has sat in its current status, and a link to the changelog entry that shipped it, if there is one.
Good to know
How is the revenue figure calculated?
How is the revenue figure calculated?
Each voter is counted once. If a voter belongs to a group that has MRR recorded, that group’s MRR is counted a single time no matter how many of its members voted. If a voter’s groups have no MRR, that voter’s own MRR is used instead. So a company and its staff can never be added together twice, and it does not matter whether you track revenue on customers, on groups, or on a mix of both.The board figure it is compared against is built the same way across your whole workspace.
What does 'one of your most requested ideas' actually mean?
What does 'one of your most requested ideas' actually mean?
Sleekplan compares this post’s upvotes against the spread of upvotes across every live post in your workspace, and reports which band it falls into: the top 10%, the top 25%, the top half, or below average. It is a position on your own board, so it stays meaningful whether you have 40 posts or 4,000.
Why do the board totals look slightly out of date?
Why do the board totals look slightly out of date?
The workspace-wide figures (total revenue, total customers, and the vote bands) are recalculated at most once every six hours. They move slowly, and reading them on every post open would be expensive on a large workspace. The post’s own numbers are always live.
Revenue at stake shows nothing
Revenue at stake shows nothing
Can my users see any of this?
Can my users see any of this?
No. Insights is admin-only. Nothing in it is returned to the widget or the public portal, so you can record revenue and weight your biggest accounts without anyone on your board noticing.
How is this different from the Impact Score?
How is this different from the Impact Score?
The Impact Score is one number you can sort the whole board by, so it answers “which post first”. Insights explains a single post in detail, so it answers “why, and who is behind it”. Most teams sort by impact to shortlist, then open Insights on the shortlist.
Related
Impact Score
Rank your whole board by real impact, and tune the weights behind the score.
Groups
Group your end users into companies and accounts, and give them revenue.
User segments
Build the segments the voter breakdown is measured against.
Feedback processing
Turn on comment sentiment and the rest of the AI triage.