
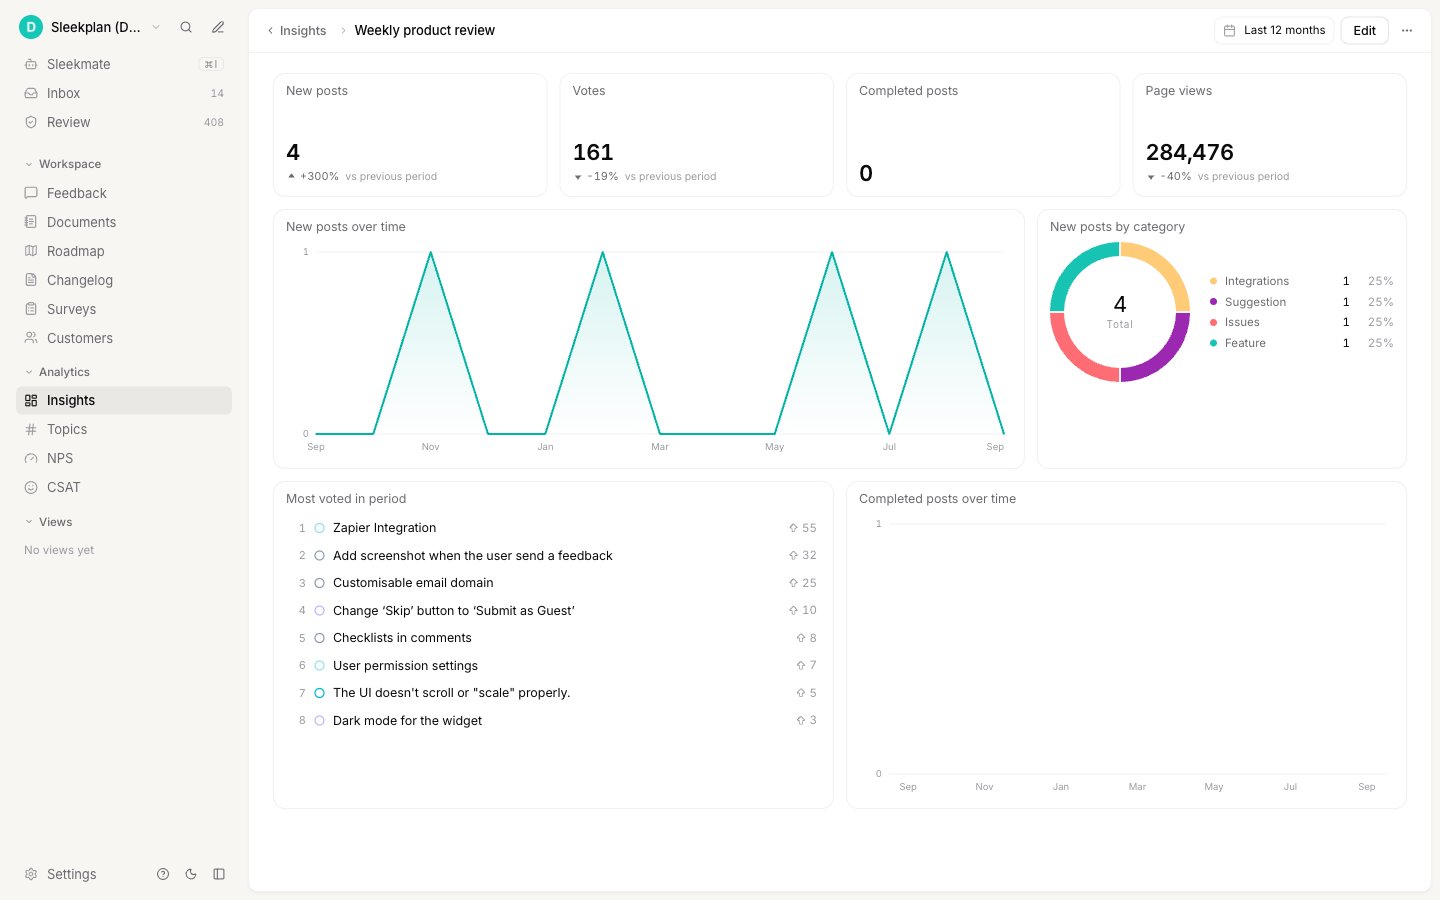
Insights dashboards look at your whole workspace. The Insights tab on a single feedback post is a different feature: it analyzes one request in depth. See Post insights.
Who can do what. Everyone on your team can open and read the dashboards that are shared with the workspace, on every plan. Creating, editing, renaming, and deleting dashboards needs the Business plan or above and the Owner or Admin role. On a lower plan, creating or saving a dashboard offers an upgrade. See Plans and billing and Roles and permissions.
Create a dashboard
1
Open Insights
In the left sidebar, under Analytics, click Insights. Then click New dashboard in the top right.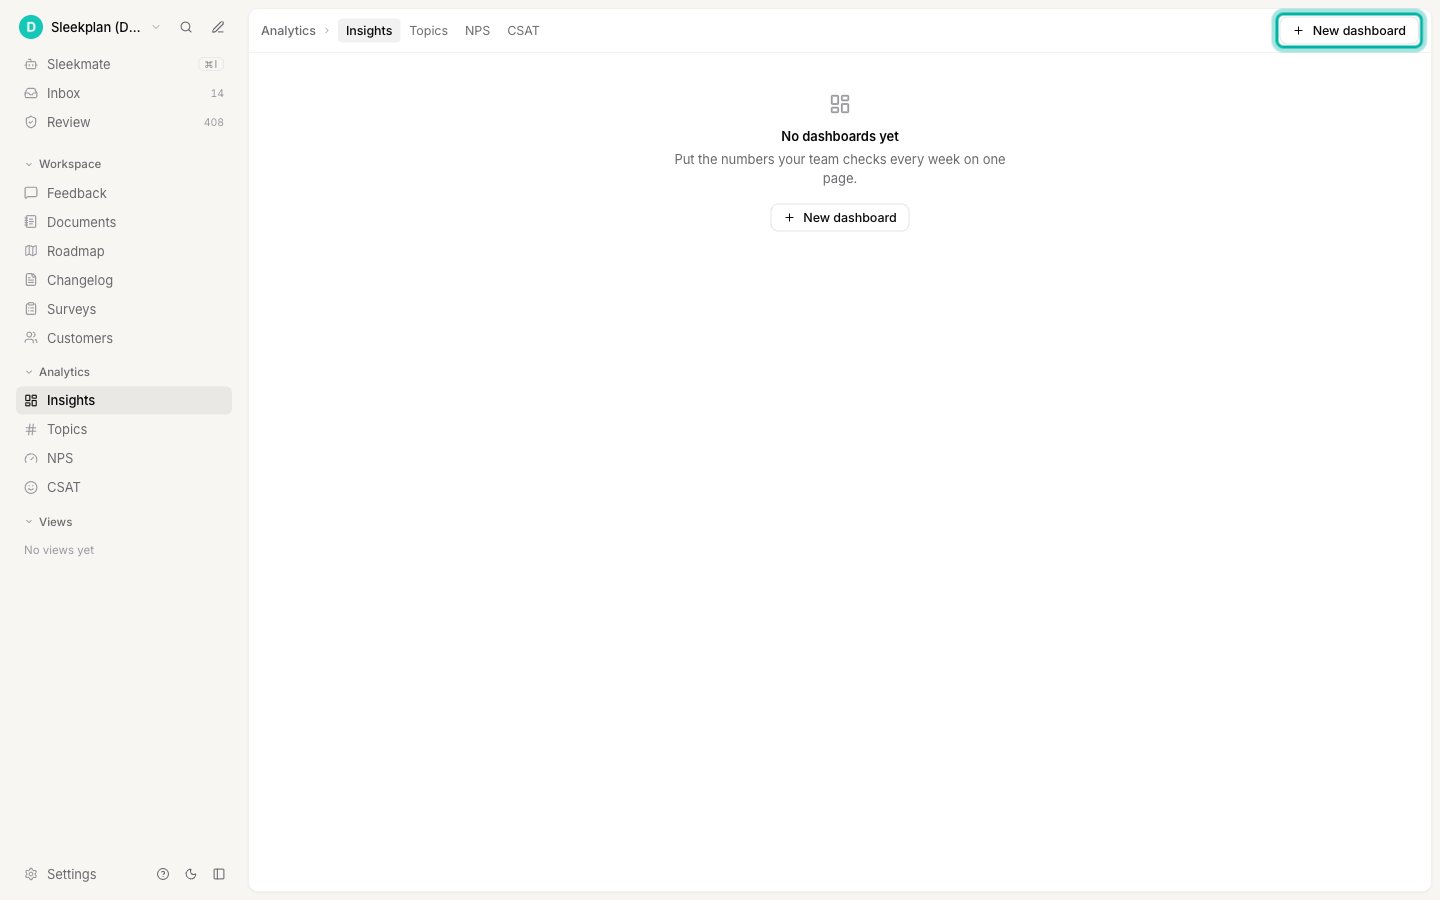
2
Name it and choose where to start
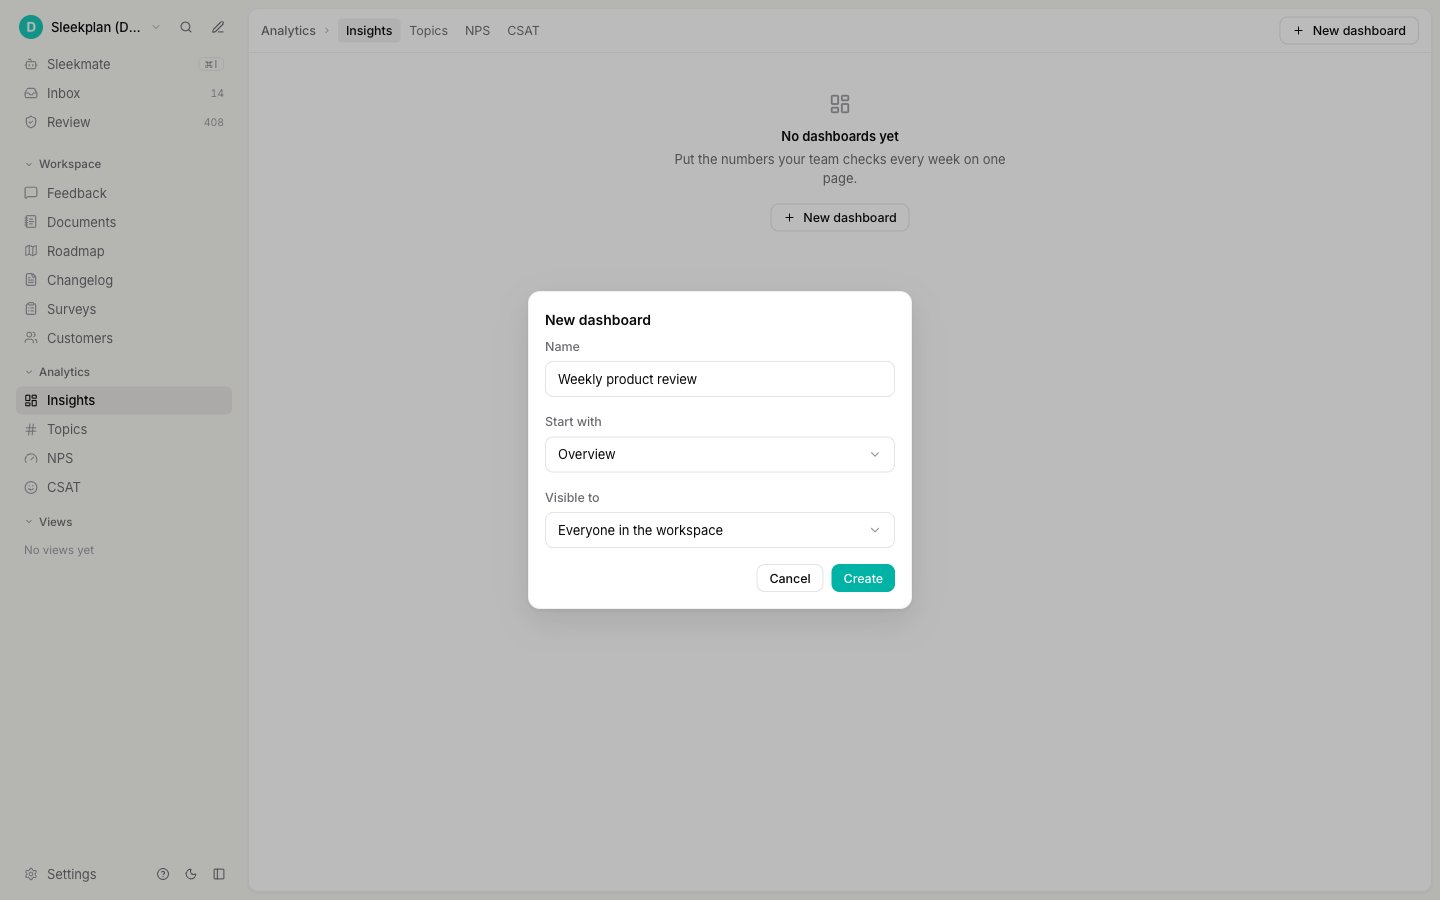
In the New dashboard dialog:
- Name: what the dashboard is for, for example “Weekly product review”. Up to 80 characters.
- Start with: Overview fills the dashboard with a ready-made set of insights (listed below). Blank starts with an empty page.
-
Visible to: Everyone in the workspace shares it with your team. Only me keeps it private. See Who can see a dashboard.
3
Create it
Click Create. The new dashboard opens right away. To add or change insights, see Add and arrange insights.
What the Overview template contains
Overview gives you a useful first dashboard in one click. It uses only feedback and page view data, so none of its insights is locked by your plan.
Every insight in the template can be changed, moved, or removed afterwards, just like one you add yourself.
Read a dashboard
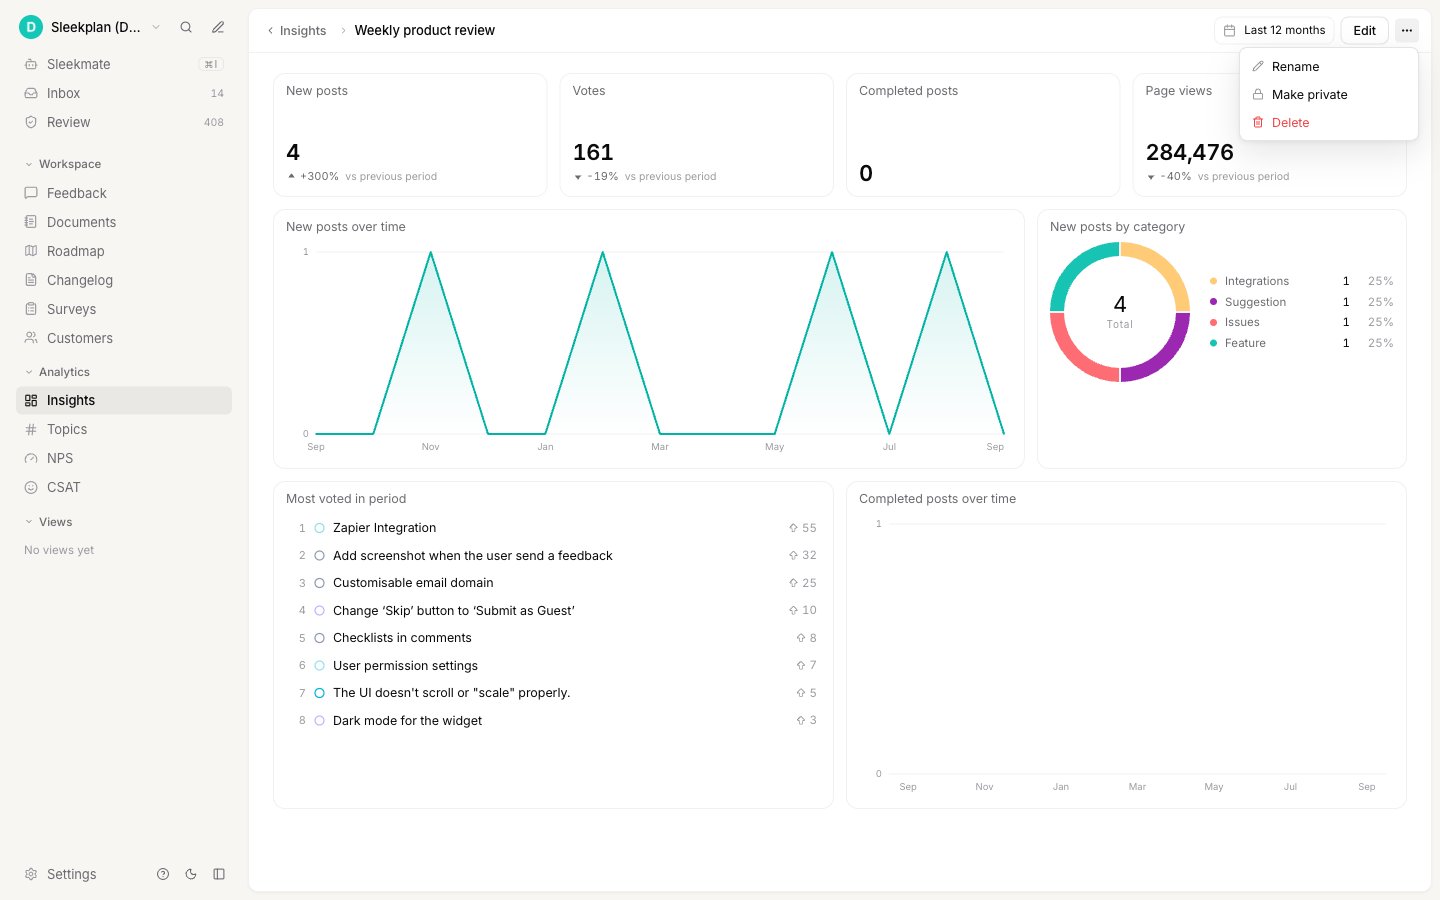
Click a dashboard in the list to open it. Each insight shows its title in the top left and the number or chart below it.- Numbers compare with the previous period. Below a number you see the change against a period of the same length just before, for example the 30 days before the last 30 days. If there’s nothing to compare against, the comparison is left out.
- Charts show exact values on hover. Move your pointer over a line, a column, or a donut slice.
- Lists link to the post. In a list of top posts, click a post to open it.
- Long breakdowns are shortened. A bar chart shows as many rows as fit and ends with “+N more”. A donut shows the five largest parts and groups the rest as Other. To see more rows, make the insight taller (see Move and resize insights).
Choose the date range
Click the date range in the top right of the dashboard. Pick a preset (Last 7 days, Last 30 days, Last 90 days, This month, Last month, This quarter, Year to date, Last 6 months, or Last 12 months), or pick a start and an end date in the calendar and click Apply.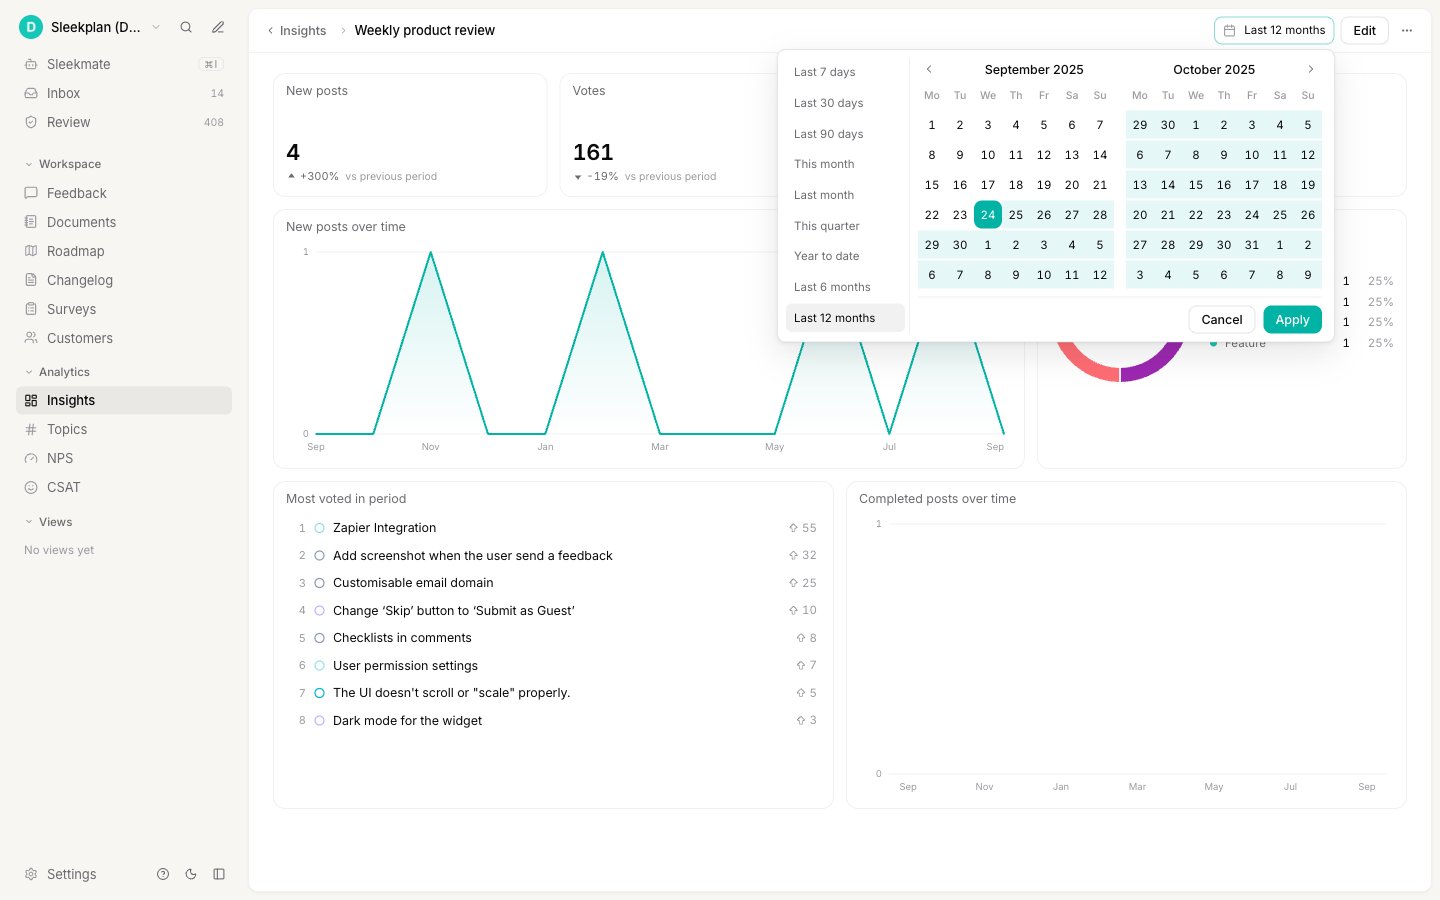
Who can see a dashboard
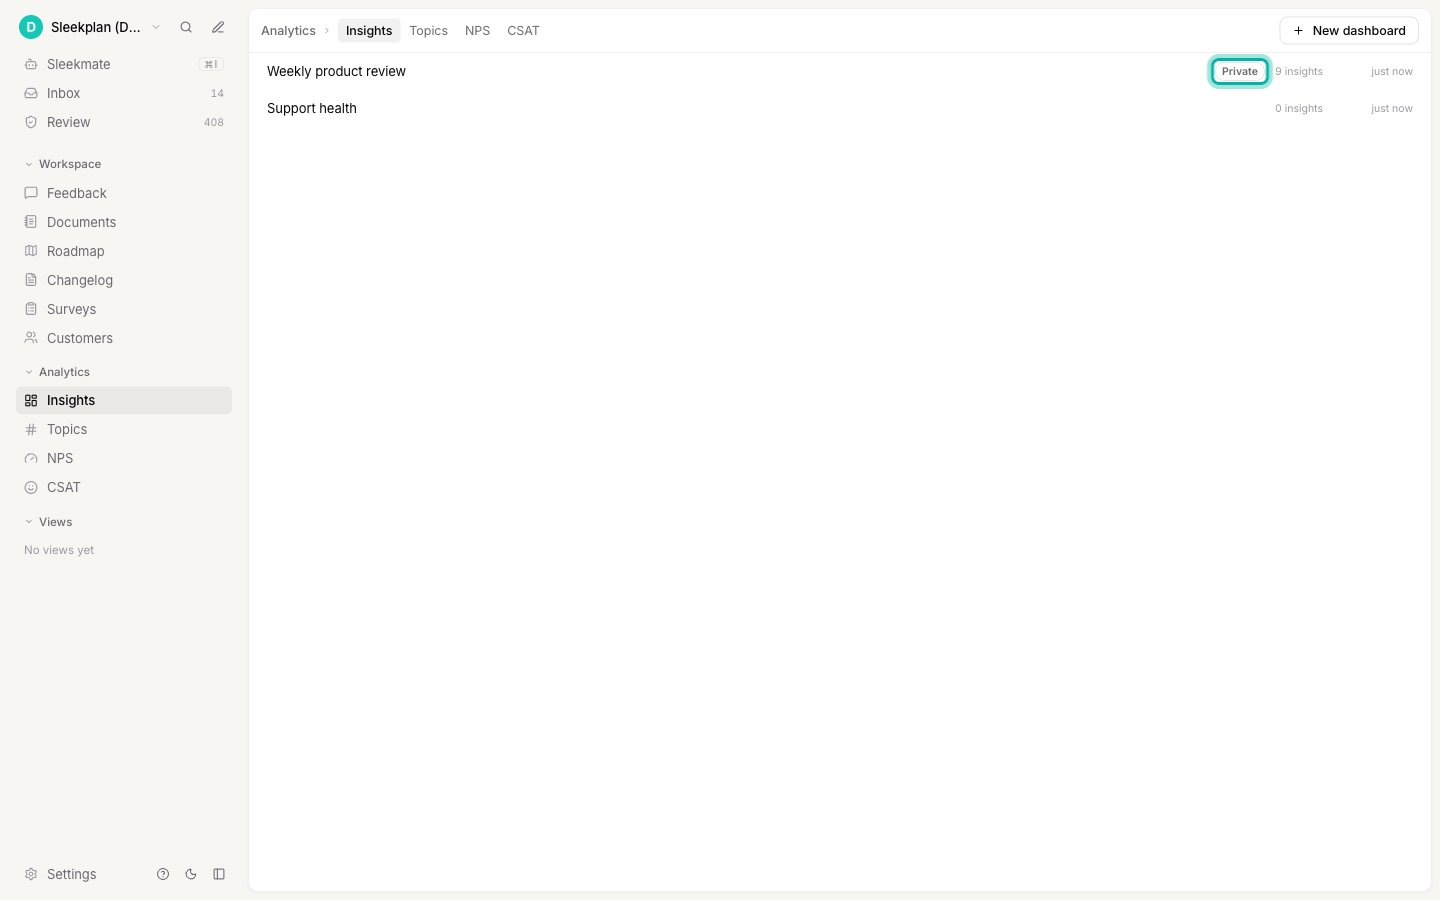
A dashboard is either shared with the whole workspace or private to the person who created it.- Everyone in the workspace (the default): everyone on your team sees the dashboard in their list and can read it. Owners and Admins can also edit it.
- Only me: only you can see the dashboard. Nobody else, not even an Owner or Admin, finds it in the list. A private dashboard shows a Private tag in the list and next to its name.
Rename or delete a dashboard
Open the dashboard, click ⋯ in the top right, and choose Rename or Delete. Deleting asks you to confirm. It permanently removes the dashboard and its insights, and for a shared dashboard that means for everyone in the workspace. Your feedback, votes, and other data are not affected: only the dashboard is gone.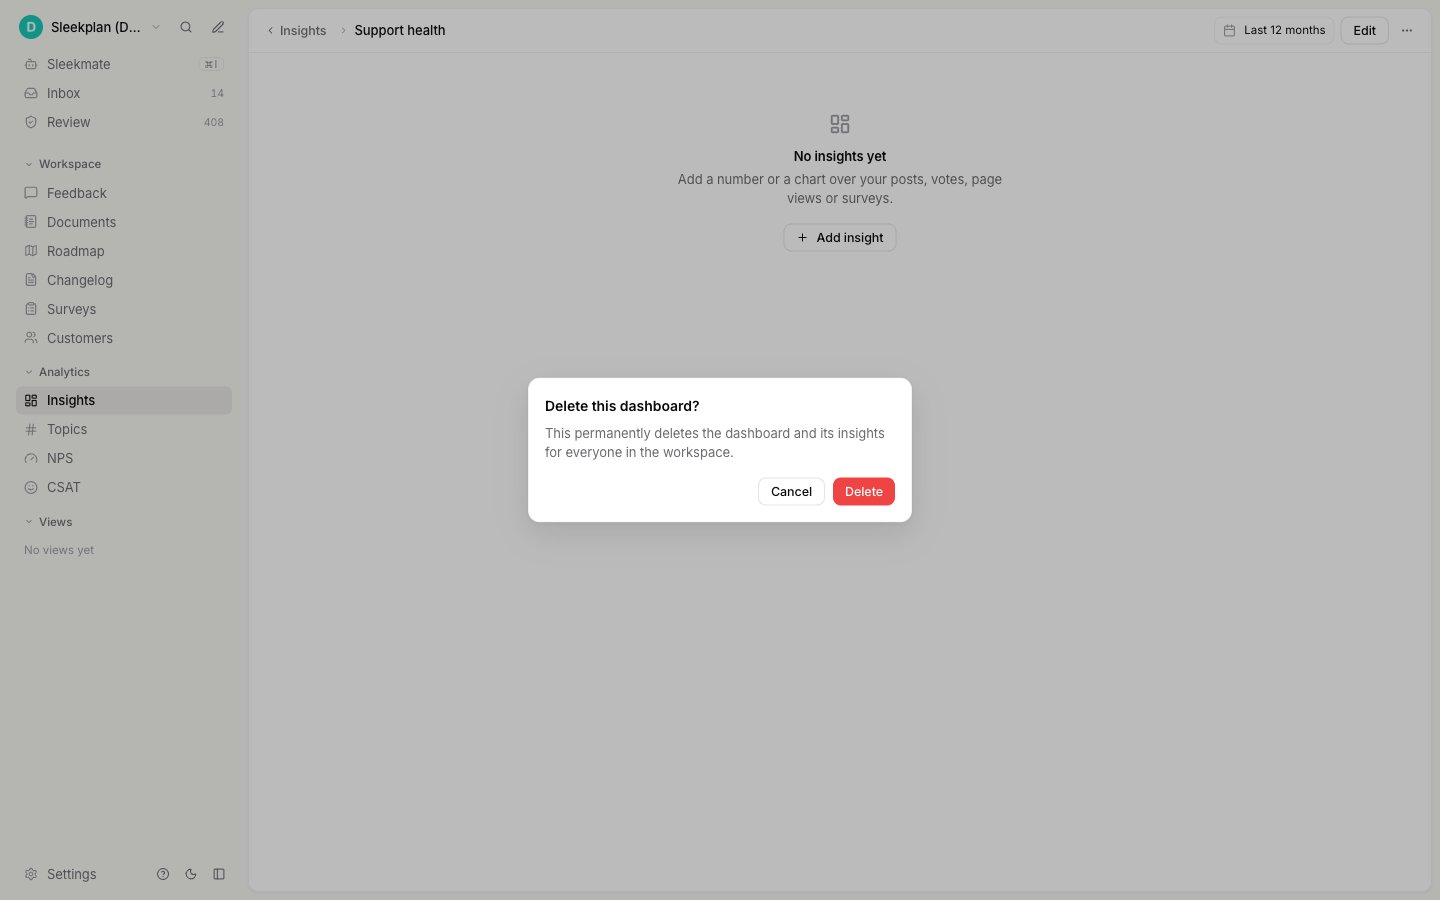
Limits
- 25 dashboards per workspace. Private dashboards count too. When the limit is reached, New dashboard is disabled.
- 24 insights per dashboard.
- Dashboard names and insight titles can be up to 80 characters.
- New activity can take up to 5 minutes to show up in a dashboard’s numbers.
- In a narrow window, for example on a phone, insights are stacked in one column and the dashboard can’t be edited. Open it on a wider screen to make changes.
Next steps
Add and arrange insights
Add numbers and charts, drag and resize them, and filter the whole dashboard.
Metrics and charts
What each metric counts and which views, breakdowns, and filters it supports.
Post insights
Analyze a single feedback post: demand, revenue, urgency, and sentiment.
Roles and permissions
See what Owners, Admins, and Members can do.