The problem with chasing shiny numbers
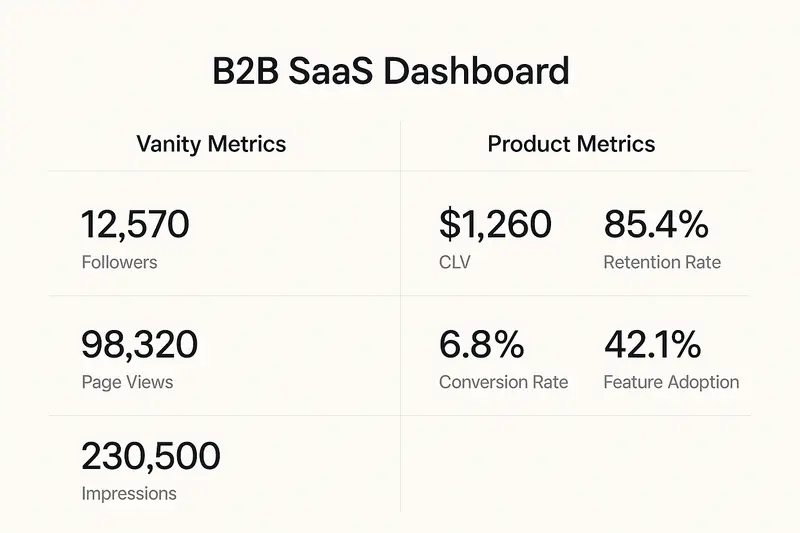
Vanity metrics look good on slides, but they rarely change a roadmap. If you want growth, focus on strategic product metrics that tie directly to value. In the first 100 words, let’s be clear about vanity metrics vs strategic product metrics. We care about numbers that influence decisions, not just attention.
According to Product School, vanity metrics inflate perceptions without guiding action. Think follower counts or raw page views. They hide gaps in activation, conversion, or retention. The fix is simple, but not easy, measure what you can act on and what you’re willing to own.
What makes a metric strategic
The best metrics feel real in daily work, not theoretical.
- Tangible, the outcome is clear to everyone, for example, paid seats, first value reached, active workspaces created.
- Controllable, teams can influence the number through their actions.
- Fast feedback, you see movement soon after a change, not quarters later.
- Testable, supports experiments like A/B tests and feature flags.
- Explainable, you can decompose shifts by segment, region, or cohort.
- Hard to game, incentives drive value, not vanity.
A simple rule of thumb, if it would be discussed in an exec meeting to change strategy, it is a strategic metric.
Core product metrics to trust
Here are the workhorse numbers that connect behavior to business outcomes.
Customer Lifetime Value
CLV estimates total net profit per customer across the relationship. It guides how much you can pay to acquire and how much to invest to retain. See the practical overview from Qualtrics for formulas and caveats. Keep an eye on the CLV to CAC ratio, 3 to 1 is a healthy benchmark for many SaaS models.
- Inputs that matter, average revenue per account, gross margin, churn rate.
- Use cases, segment by plan, region, or industry to find where to invest.
- Example, moving onboarding help from email to in-app cut early churn 20 percent, CLV rose within a quarter.
External reference, https://www.qualtrics.com/experience-management/customer/customer-lifetime-value/
ARPU or RPU
Average revenue per user reveals pricing power and value per account. Track it by cohort and plan. Look for clean increases without harming retention. Rising ARPU with stable churn usually signals real value creation.
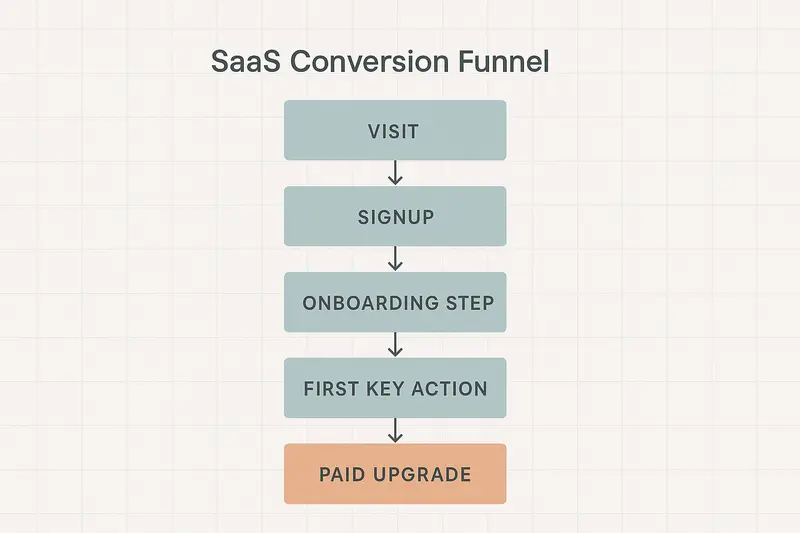
Conversion rate, macro and micro
Beyond traffic, measure the journey. Map the path to paid and the steps that predict it.
- Macro conversions, trial start, paid upgrade, annual prepay.
- Micro conversions, email verified, first project created, first teammate invited.
- Where to look, message clarity, page speed, onboarding steps, paywall copy.
Reference guide, https://contentsquare.com/guides/conversion-rate-optimization/metrics/
Retention and engagement
DAU, WAU, MAU are useful when defined with intent. Tie them to meaningful actions, not any click. Track DAU over MAU for depth of engagement. Pair with churn and reactivation rates to see the full picture.
- Practical tip, define an Active User as a user who completes your core action, for example, publishes a release note, closes a feedback loop, or views a dashboard.
- Early warning, a falling DAU over MAU ratio often precedes churn.
Product adoption, the quiet lever
Adoption is the bridge between interest and value. If users do not hit first value fast, everything downstream leaks.
- Time to First Key Action, how quickly a new user experiences core value.
- Feature adoption rate, percent of active users who use a given capability.
- Frequency of use, how often the core action happens in a period.
Patterns we look for, users who invite a teammate within 48 hours often retain at 2x. When a feature’s adoption is low but satisfaction is high for users who find it, the problem is discoverability, not value.
For a primer on adoption metrics and how to read them, Product School has a good starting point, https://productschool.com/blog/product-strategy/product-adoption-metrics.
A simple framework to choose metrics
Anchor on one North Star Metric, then map inputs you can move.
- Pick a North Star that reflects value delivered, not just activity.
- Identify inputs by breadth, depth, frequency, and efficiency.
- Connect inputs to teams with clear ownership.
Helpful deep dive from Amplitude, https://amplitude.com/blog/product-north-star-metric
We pair this with OKRs so roadmaps ladder up to outcomes. Outputs are not enough. A released feature means little until it moves a number you agreed matters.
Avoid the traps
Good intentions can still lead you astray.
- Gaming, if bonuses hinge on one metric, expect people to contort the system. Add counter metrics, for example, measure time on page with scroll depth and conversion, not in isolation.
- Over measurement, too many dashboards create noise. Keep a concise set for weekly review, park the rest for monthly analysis.
- Measurement without action, insights need owners and deadlines. We assign a DRI for every red metric and set a date for the next readout.
Turning feedback into metrics you can ship against
Metrics should reflect customer reality, not the other way around. Product feedback, when structured, is a powerful input to your metric stack. We use Sleekplan to group requests by theme, link them to adoption and retention, and spot the features that matter. If you want help connecting feedback to measurable outcomes, explore Sleekplan Intelligence, https://sleekplan.com/intelligence/
Tooling and data hygiene, do the boring work well
Data quality is craft. Define events in a shared schema, keep names stable, document calculations, and sample dashboards with real users. Small choices, like what counts as an activation event, change strategy. When in doubt, write the definition in plain language, then implement.
Quick answers
- What are vanity metrics, Numbers that make you look busy without changing decisions, for example, page views without conversion context.
- Which product metrics matter most, CLV, retention, conversion rate, ARPU, and adoption metrics tied to first value.
- How do I pick a North Star, choose one number that captures value delivered to customers, then define a small set of input metrics you can move.
- How often should I review metrics, weekly for core inputs, monthly for deeper analysis and cohort trends, quarterly for strategy resets.
One last principle
Chasing speed is easy. Building a clean measurement system is harder. Take the time. The craft shows in the details, strict definitions, reliable data, crisp visuals, and the discipline to act when a number moves.
Further reading used in this guide
- Vanity vs strategic metrics, https://productschool.com/blog/analytics/vanity-vs-strategic-metrics
- Conversion metrics overview, https://contentsquare.com/guides/conversion-rate-optimization/metrics/
- CLV foundations, https://www.qualtrics.com/experience-management/customer/customer-lifetime-value/
- North Star metric framework, https://amplitude.com/blog/product-north-star-metric