Product teams do great work that never shows up in the board deck. Then budget season arrives. If your roadmap reads like a to-do list, the CFO reads it like a cost center. To prove product value, you need a clear definition, a connected evidence trail, and language that maps features to revenue, retention, and risk.
We will ground this in practice, not theater. Quality over speed, clarity over noise, craft over cargo cult. Product ROI is measurable if you build proof into how you work.
What counts as product value
Start with definitions. To prove product value, separate two truths that coexist:
- Real value: measurable outcomes like time saved, cost reduced, errors avoided, revenue added. See this explainer on how businesses create value to set a shared baseline.
- Perceived value: how quickly users feel that value. Onboarding, messaging, and interface choices change time to value. Useful background from Product School on real vs perceived value.
Equally important, balance hard and soft benefits. Hard benefits are direct and easy to price. Soft benefits like higher CSAT, fewer support escalations, or lower defect density are real, they just require a benefits rationale that ties them to financial impact. The PMI perspective on soft benefits is a practical guide for building that chain of reasoning.
Takeaway: define value across dimensions, then decide which slices you will measure first.
Three levels of product ROI, three kinds of proof
Stakeholders ask different ROI questions with the same words. Use the right level of analysis for the room.
- Organizational ROI: does the product function earn its keep over years. Build a rolling evidence base, not a one-off deck. Reference: ProdPad on proving product ROI.
- Initiative ROI: did a strategic bet deliver the expected outcome. Frame as hypotheses, define metrics upfront, measure over a defined window.
- Experiment or metric ROI: did a specific change move a specific metric. Useful for fast feedback, risky for revenue attribution. Do not promise per-ticket ARR.
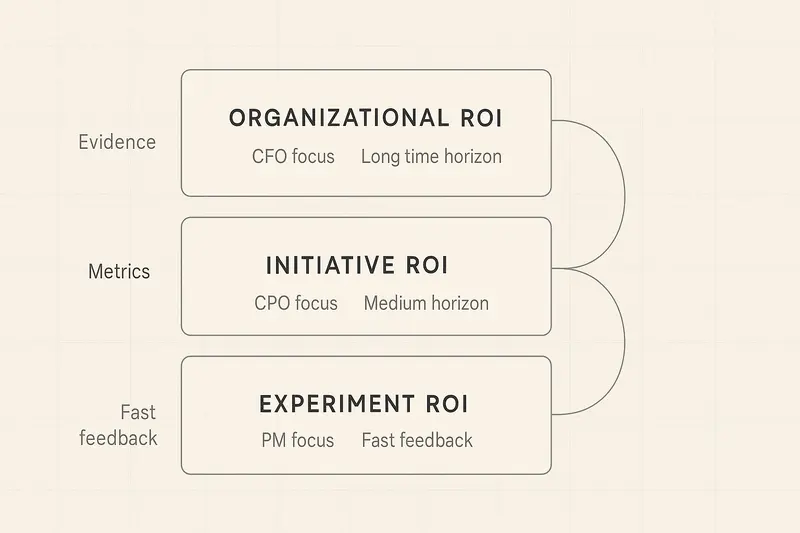
Takeaway: never try to prove organizational ROI with feature-level math.
Build the evidence trail, not a quarterly story
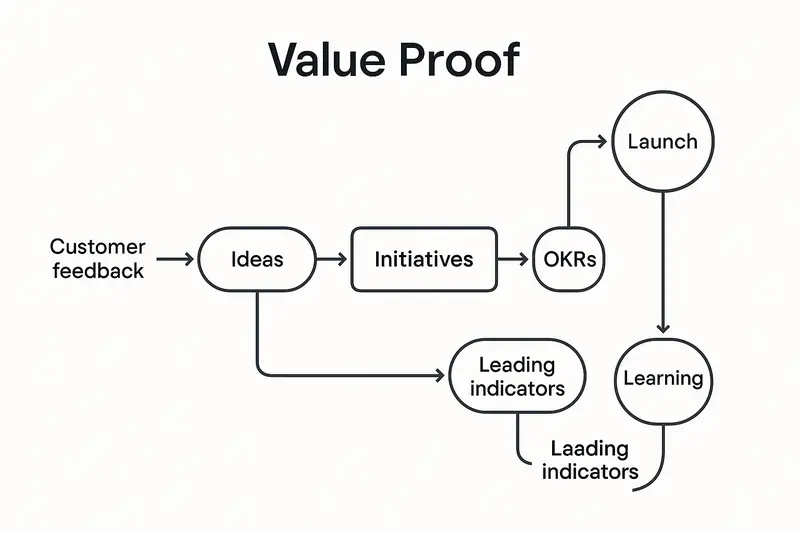
Evidence should fall out of your workflow, not be invented at quarter end. Tie customer signals to outcomes in one connected system:
- Feedback becomes ideas, ideas map to initiatives, initiatives connect to OKRs, launches track leading and lagging indicators, learnings loop into strategy.
- Use pre-written hypotheses: If we solve X for Y segment, we expect Z behavior change that drives W business metric.
- Define success and guardrails before launch. When you simplify onboarding, watch activation, then also watch support volume and data quality. NN/g’s guide to A/B testing is a helpful reference for guardrails.
If you need a toolchain to support this, see how Sleekplan captures customer feedback and connects it to roadmaps and changelogs in one place: https://sleekplan.com/features/.
Takeaway: when the system is connected, the story tells itself.
Metrics that matter, in pairs
Focus on a small set that maps to strategy. Pair leading with lagging so you can steer weekly yet prove value quarterly. BMC’s primer on leading vs lagging indicators is a solid refresher.
Leading indicators:
- Activation rate by segment
- Time to first value
- Feature adoption depth for high-value actions
- Goal completion in core workflows
Lagging indicators:
- Net revenue retention and expansion ARR
- Churn and 90-day or 180-day retention
- ARPU, CAC payback, gross margin
Example in practice: we trimmed enterprise onboarding from 14 to 7 steps, cut setup time by 38 percent, saw activation +12 points in 30 days, and 90-day retention +7 points two quarters later. Support tickets held flat, so no hidden cost.
Takeaway: pick five or fewer, document why, stick with them.
Communicate value in the language of money
Executives filter for currency symbols. Translate product metrics into business impact without pretending to know the fifth decimal.
- Lead with revenue or risk: Improving feature adoption in our highest-value segment is projected to add 15 percent expansion ARR within two quarters, range 2 to 5 million.
- Use ranges: sophistication beats false precision. Mind the Product’s guidance on revenue ranges is worth a read.
- Tag the roadmap with revenue hypotheses: each swim lane carries a magnitude. When priorities shift, show the opportunity cost in dollars, not in story points.
- Hold the line on the or principle: doing A means not doing B. Make that tradeoff visible in ARR terms.
Takeaway: translate, do not inflate.
Do impact analysis before you bet
Impact analysis reduces rework and sharpens your value claim.
- Functional: map user workflows and dependencies so a new flow does not break power-user habits.
- Technical: review performance, security, and scalability risks with engineering leads.
- Business: specify who benefits, how behavior changes, and which metric should move.
This discipline turns “great idea” into a testable thesis and a cleaner launch plan.
Stage-appropriate proof across the product lifecycle
Match proof to stage, not to wishful thinking.
- Stage 1 problem validation: proof lives in customer interviews and pain frequency, not dashboards.
- Stage 2 solution validation: low-fi prototypes with clear signals that customers would use it.
- Stage 3 product validation: activation, retention, and usage by cohort for a working MVP.
- Stage 4 business validation: LTV, CAC, payback, and margin that justify scale.
Takeaway: ask for the right kind of evidence at the right time.
Common obstacles, practical counters
- Skepticism of product metrics: translate activation or adoption into LTV and ARR effects with a simple, defensible model. Start conservative.
- Attribution messiness: use A/B tests when you can, plus counterfactual estimates, and be explicit about confidence. NN/g’s A/B testing guide is a good practice source.
- Long lags: show the ladder of indicators, weekly leading then monthly lagging, so patience has proof points.
- Ignored soft benefits: borrow PMI’s structure, tie CSAT or quality to retention or cost-to-serve with traceable assumptions.
Takeaway: clarity beats certainty that nobody believes.
Short answers to questions you will get
- What is the fastest way to prove product value? Start with leading indicators tied to a specific initiative, for example activation or time to first value, then show the first lagging movement, for example 30-day retention.
- How do I attribute revenue to a feature without fiction? You do not. Attribute to the initiative level, use ranges, and triangulate with experiments plus cohort deltas. See ProdPad’s take on avoiding feature-level ROI traps.
- Which metrics should we track by default? A compact set: activation, feature adoption depth, goal completion, retention by cohort, NRR, CAC payback. Expand only when strategy changes.
A calm close
Proving product value is a craft. Define value clearly, build a connected evidence trail, measure a few right things, and communicate in the language your stakeholders already speak. The payoff is more than budget approval. It is trust.
Further reading from the sources above:
- Product value, real vs perceived: https://productschool.com/blog/analytics/product-value
- Proving product ROI across levels: https://www.prodpad.com/blog/proving-product-roi/
- Leading vs lagging indicators: https://www.bmc.com/blogs/leading-vs-lagging-indicators/
- Soft benefits rationale: https://www.pmi.org/learning/library/soft-benefits-are-real-9694