A CSAT calculator that runs both formulas on the same responses.
Support ticket
Support ticket CSAT
When to ask
Immediately after the ticket is marked resolved, in the reply itself or in the widget. Within the hour, not the next morning.
The question
How satisfied are you with the help you received?
The scale
1 to 5. Label every point: 1 Very dissatisfied, 2 Dissatisfied, 3 Neutral, 4 Satisfied, 5 Very satisfied.
The follow-up
What would have made this a 5? One optional open field, never required.
Which formula to report
Top-2-box. A support desk needs a threshold it can act on, and the count of 1s and 2s is a work queue rather than a statistic.
Onboarding
Onboarding CSAT
When to ask
At the end of the first week, once setup is finished. Not on day one: there is nothing to rate yet.
The question
How satisfied are you with how your first week went?
The scale
1 to 7, labelled at the ends only: 1 Very dissatisfied, 7 Very satisfied.
The follow-up
What was the hardest part of getting set up?
Which formula to report
Mean-based, and print the mean out of 7 next to the percentage. Top-2-box on a seven-point scale counts only 6 and 7, so it treats every 5 as a failure and discards most of the movement the longer scale was chosen for.
In-app moment
In-app moment CSAT
When to ask
On the screen where the job was just done: a report exported, an invoice sent, a workflow published. Throttle it so nobody is asked twice in a quarter.
The question
How satisfied are you with [the thing they just did]?
The scale
1 to 5 stars or smileys. One tap, with no required text field behind it.
The follow-up
Anything we should fix here? Optional.
Which formula to report
Top-2-box, per moment, never pooled across moments. Two triggers with different populations averaged into one number will move when traffic shifts and nothing else changed.
New feature
New feature CSAT
When to ask
After the person has used the feature twice, not the first time. First use measures your onboarding; second use measures the feature.
The question
How satisfied are you with [feature name] so far?
The scale
1 to 5, the same scale as your other surveys, so the number is comparable to them.
The follow-up
What were you trying to do the last time you used it?
Which formula to report
Both, and read the gap between them. A new feature is where opinion splits hardest, and a wide gap is the signal that you have two populations rather than one average user.
The two CSAT formulas, and why they disagree
Customer Satisfaction Score has two formulas in common use and they answer different questions. Top-2-box counts the share of respondents who picked either of the two highest options, usually 4 and 5 on a five-point scale: satisfied responses divided by total responses, times 100. Mean-based CSAT averages every rating instead, then divides that average by the scale maximum to express it as a percentage.
In a spreadsheet with raw ratings in column A, top-2-box is COUNTIF(A:A,">=4")/COUNT(A:A)*100 and mean-based is AVERAGE(A:A)/5*100. Both work unchanged in Excel and Google Sheets. On a seven-point scale, change the 4 to a 6 and the 5 to a 7.
The two move apart whenever opinion is split. A set of 100 responses that is half fives and half ones gives a top-2-box CSAT of 50% and a mean of 3.00, which rescales to 60%: ten points of disagreement from the same answers. Neither is wrong. Top-2-box measures enthusiasm, mean-based measures central tendency, and a report that names only one of them hides the fact that the other exists.
The gap does not always run the same way. Ratings that pile up on 4 push top-2-box above mean-based, because a 4 counts in full toward top-2-box and only 80% toward the mean. Ratings that split to both ends push mean-based above top-2-box. Pick the formula before you see the number, write it next to the score, and keep it there.
A worked CSAT calculation on four response shapes
Each row below is 100 responses to one of the four survey templates above, scored by both formulas. Counts are listed highest rating first, so 62, 21, 9, 4, 4 means 62 people picked 5, 21 picked 4, nine picked 3, four picked 2 and four picked 1. The gap column is mean-based minus top-2-box, in percentage points. Enter any row into the calculator and you get the same numbers back.
The spread is widest on the seven-point scale. Onboarding CSAT below is an ordinary, healthy distribution, and the two formulas report 58.0% and 79.1% for it: 21 points apart, decided entirely by which formula the team picked. Top-2-box on a seven-point scale means 6 and 7, so every 5 counts as a failure, while the mean treats a 5 as 71% of a perfect answer.
Which one to report follows from what the number is for. Top-2-box when you need a threshold to act on, because it answers how many people were actually happy. Mean-based when you are tracking movement on a stable scale, because it uses every rating instead of collapsing them into satisfied or not. On a two-point thumbs scale the choice disappears and mean-based becomes useless: with only 1 and 2 available it can never fall below 50%, however bad the week was.
| Survey | Responses, highest rating first | Top-2-box | Mean-based | Gap |
|---|---|---|---|---|
| Support ticket CSAT | 1 to 5: 62, 21, 9, 4, 4 | 83.0% | 86.6% (mean 4.33) | +3.6 points |
| Onboarding CSAT | 1 to 7: 28, 30, 22, 12, 5, 2, 1 | 58.0% | 79.1% (mean 5.54) | +21.1 points |
| In-app moment CSAT | 1 to 5: 30, 55, 10, 3, 2 | 85.0% | 81.6% (mean 4.08) | -3.4 points |
| New feature CSAT | 1 to 5: 40, 8, 6, 6, 40 | 48.0% | 60.4% (mean 3.02) | +12.4 points |
What counts as a good CSAT score
There is no single good CSAT score, and the pages that publish bands like 90 to 100 exceptional, 70 to 89 good rarely say where the bands came from. Three sources are worth knowing because they are published, dated and attributable. Two of them are not measured the way this calculator measures, and that difference matters more than the numbers do.
The American Customer Satisfaction Index put the United States national score at 76.1 for the second quarter of 2026, down from 76.7 in the first quarter, in a release dated 11 August 2026. It is built from roughly 200,000 interviews a year across more than 400 companies in more than 40 industries. Its 2026 sector studies, each with its own fieldwork window, run from 80 for audio streaming and specialty retail, through 79 for online retail, 77 for wireless service and for hotels, 76 for airlines and 75 for social media, down to 73 for internet service providers.
ACSI is a 0 to 100 index, not a percentage of satisfied customers, and it is not produced by the arithmetic on this page. It comes from a multi-question model weighting expectations, perceived quality and perceived value, drawn from a national sample rather than from your customers at your moment. Reading a 76% top-2-box as level with the national 76.1 compares two different instruments. That confusion is the origin of most of the unsourced CSAT bands in circulation: they are index-shaped numbers wearing a percentage sign.
For a benchmark measured the way this calculator measures, Retently's 2026 CSAT benchmarks, published 8 April 2026, report a dominant range of 65% to 80% across industries, with financial services at 81%, ecommerce and retail at 77% and internet and software services at 64%. Retently publishes no sample size or methodology beside those figures, which is a reason to treat them as orientation rather than as a target. Zendesk's guidance, last updated 21 November 2025, calls 75% to 85% good and above 90% exemplary, and presents itself as a rule of thumb rather than as measured data.
Your own previous quarter beats all of them, provided it was collected on the same scale, at the same trigger, with a comparable number of responses. That is three conditions, and a benchmark comparison that fails any one of them is decoration.
How much of your CSAT is sampling noise
A CSAT of 80% from 50 responses and a CSAT of 80% from 2,000 responses are not the same finding, and no calculator on the first page of results says so. The 95% interval on a proportion is 1.96 times the square root of p times one minus p, divided by n. At p = 0.80 and n = 50 that is plus or minus 11.1 points, so the honest reading of that 80% is somewhere between 69% and 91%.
The interval shrinks with the square root of the sample, which means four times the responses to halve it. The same 80% is plus or minus 5.5 points at 200 responses and plus or minus 2.5 points at 1,000. It also widens as the score approaches 50%: at p = 0.50 and n = 50 the interval is plus or minus 13.9 points, not 11.1, so a mediocre score is measured less precisely than a good one.
The practical consequence is the one most CSAT dashboards get wrong. A move from 80% to 84% on 50 responses a month is not an improvement, and treating it as one is how a team spends a quarter chasing a number that never moved. The calculator prints this interval next to the top-2-box score at whatever sample size you entered.
Where the responses come from
Arithmetic is the easy half. The number is mostly decided before any calculator runs, by the moment you asked at, how many people answered, and whether the question was worded the same way last quarter. A CSAT that moved because the trigger changed from ticket closed to ticket closed and not reopened within 48 hours has measured the trigger, not satisfaction.
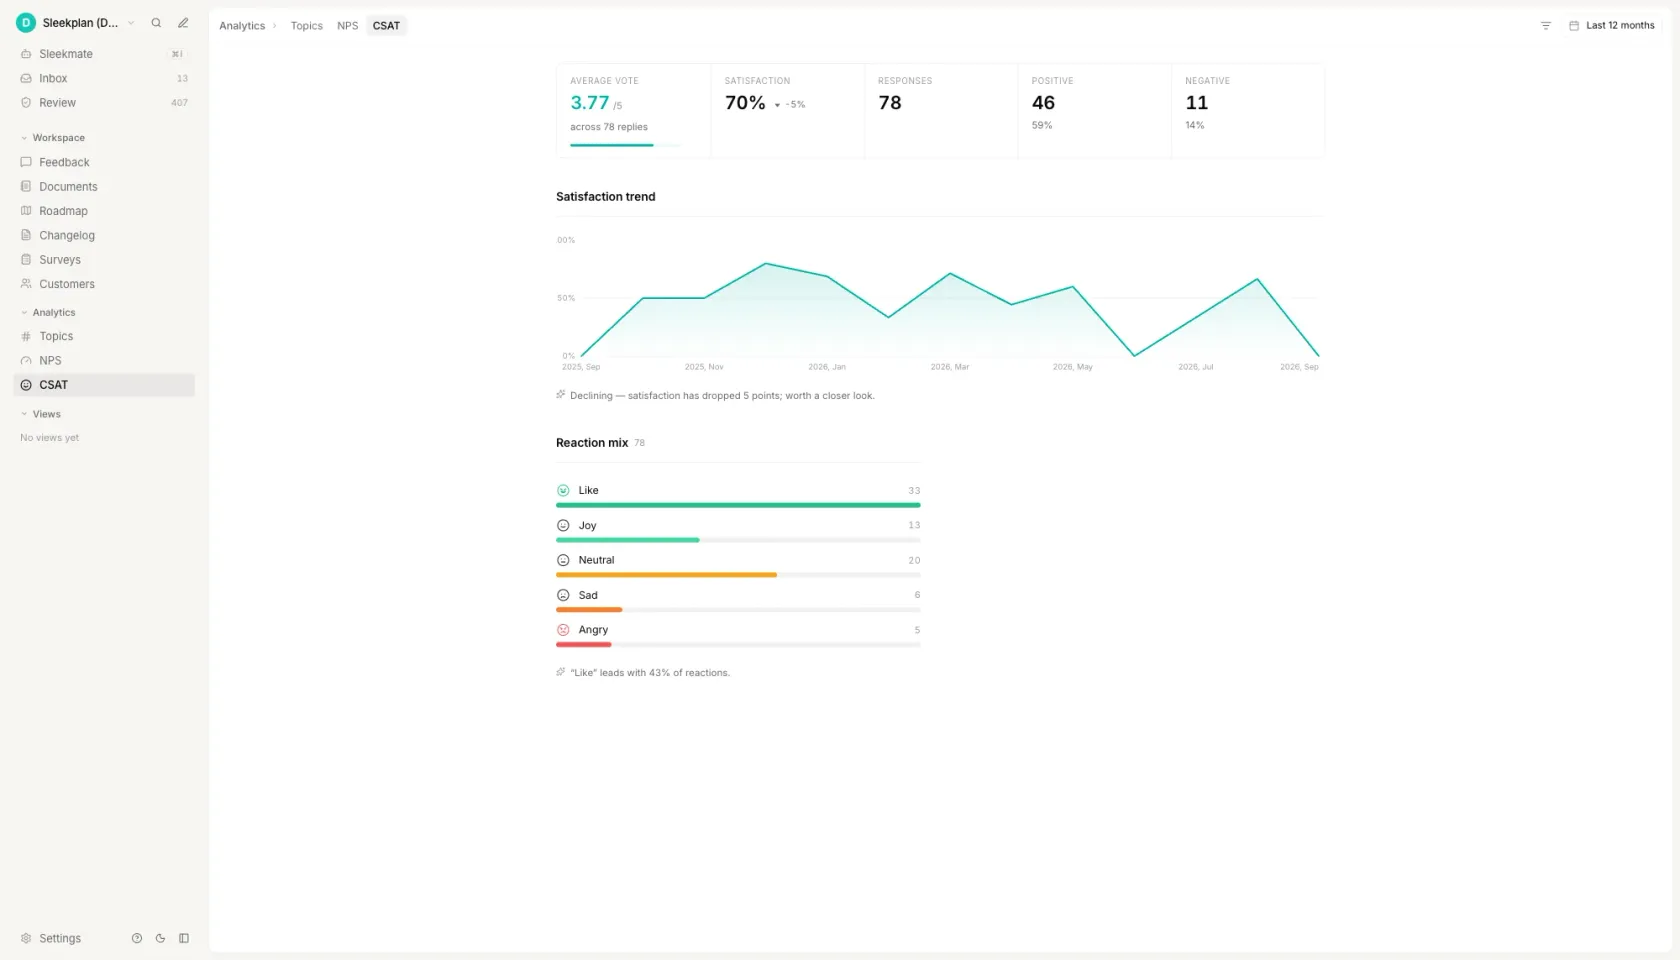
That collection half is what Sleekplan does. A survey fires on a path or a journey, checkout, settings, the end of onboarding, on a scale you set once, and cohort throttling stops the same person being asked twice in a quarter, which is the most common way a CSAT sample quietly stops being representative. An optional open question captures the reason next to the rating, and the dashboard reports rolling 30, 90 and 365-day scores instead of one survey round.
Because the responses land in the same workspace as the feedback board, a 2 out of 5 is one click from whatever that customer has been asking for, and a detractor can page a Slack channel within seconds rather than surfacing in a quarterly review. That also removes the sample size problem above: a trigger that fires on every resolved ticket collects hundreds of responses a quarter without anyone launching a campaign.
How to calculate CSAT
Ask one rating question on a fixed scale
One question, one scale, the same wording every time. Five points is the default; seven is used when you expect the score to move slowly and want the resolution. The choice matters far less than never changing it, because a scale change breaks comparison with every period before it. Label the points in words as well as numbers, so a 3 means the same thing in every language you ask in.
Decide what counts as satisfied before you look at the data
This is the step that changes the number. On a five-point scale, top-2-box counts 4 and 5 as satisfied and top-box counts only 5. On a seven-point scale, top-2-box is 6 and 7, so a 5 becomes a failure. Write the choice down next to the score. A team that decides after seeing the data will pick whichever definition flatters the quarter, and the series stops meaning anything from that point on.
Count the responses at each rating point
You need one count per rating, not a list of scores. Export the raw column from your helpdesk or survey tool and count it, or paste the column into the calculator above and let it count. Use completed responses only: someone who closed the survey did not answer 3, and folding abandonments in as neutral is a common way to invent a number that looks calmer than the truth.
Run both formulas on the same counts
Top-2-box is satisfied responses divided by total responses, times 100. Mean-based is the average rating divided by the scale maximum, times 100. Run both on the same counts. If they agree to within a point or two, the distribution is clustered and either will do. If they are ten points apart, opinion is split, and the single number you were about to report is hiding that.
Check the result against your sample size, then against a benchmark
At 50 responses an 80% top-2-box score carries a 95% interval of plus or minus 11 points, so next month's 84% is noise. Then compare like with like: a CSAT collected after a resolved ticket is not comparable to one collected after onboarding, and neither is comparable to a national index built with a different instrument and a different question.
Questions people ask
What is the CSAT formula?
CSAT is satisfied responses divided by total responses, times 100. On a five-point scale, satisfied normally means the answers 4 and 5, which is the top-2-box method. The second formula in common use averages every rating and divides by the scale maximum instead, and it returns a different number whenever opinion is split: 50 fives and 50 ones are 50% by top-2-box and 60% by the mean. In a spreadsheet the two are COUNTIF(A:A,">=4")/COUNT(A:A)*100 and AVERAGE(A:A)/5*100.
What is a good average CSAT score?
The published benchmarks disagree because they are not measured the same way. Retently's 2026 CSAT benchmarks, published 8 April 2026, give a dominant range of 65% to 80% across industries. Zendesk's guidance, updated 21 November 2025, calls 75% to 85% good as a rule of thumb. The American Customer Satisfaction Index scored the United States at 76.1 for the second quarter of 2026, but that is a 0 to 100 index from a multi-question model rather than a percentage of satisfied respondents, so it is not comparable to a top-2-box score at all.
Is 80% CSAT good?
It sits inside every published band, and on its own it says very little, because three things are usually missing when it is quoted. Which formula: 80% top-2-box and 80% mean-based are different claims about the same responses, and on a split set they can be ten points apart. Which moment: a post-ticket 80% and a post-onboarding 80% are not the same measurement. And the sample size: at 50 responses, 80% carries a 95% interval of plus or minus 11.1 points, so the honest statement is somewhere between 69% and 91%. An 80% that beats your own previous quarter on the same trigger, the same scale and a comparable number of responses is good. An 80% with none of that attached is a rounding.
What is a CSAT score of 5 out of 5 considered?
A single 5 out of 5 is one satisfied respondent, not a score. CSAT only exists once you divide by the total. If every respondent picked 5, CSAT is 100% by both formulas, which in practice usually means the sample is very small or the question reached only people with no reason to complain. A period with no 1s and no 2s in it is a sampling question before it is a result.
How do you calculate a CSAT score out of 5?
Count how many people picked each rating from 1 to 5. Add the 4s and the 5s, divide by the total number of responses and multiply by 100: that is top-2-box CSAT. For the mean version, multiply each rating by its count, add the products, divide by the total to get the average out of 5, then divide by 5 and multiply by 100. With 62 fives, 21 fours, nine threes, four twos and four ones, those two calculations give 83.0% and 86.6% from the same 100 answers.
Your roadmap,
on autopilot.
Free for 30 days. No card, no sales call. Cancel anytime.