Modules/ Insights

Every number your team checks, on one page.

Build feedback dashboards from 22 metrics, from new posts and votes to response times, NPS and closed loops. Everyone on the team opens the same page and sees the same numbers.
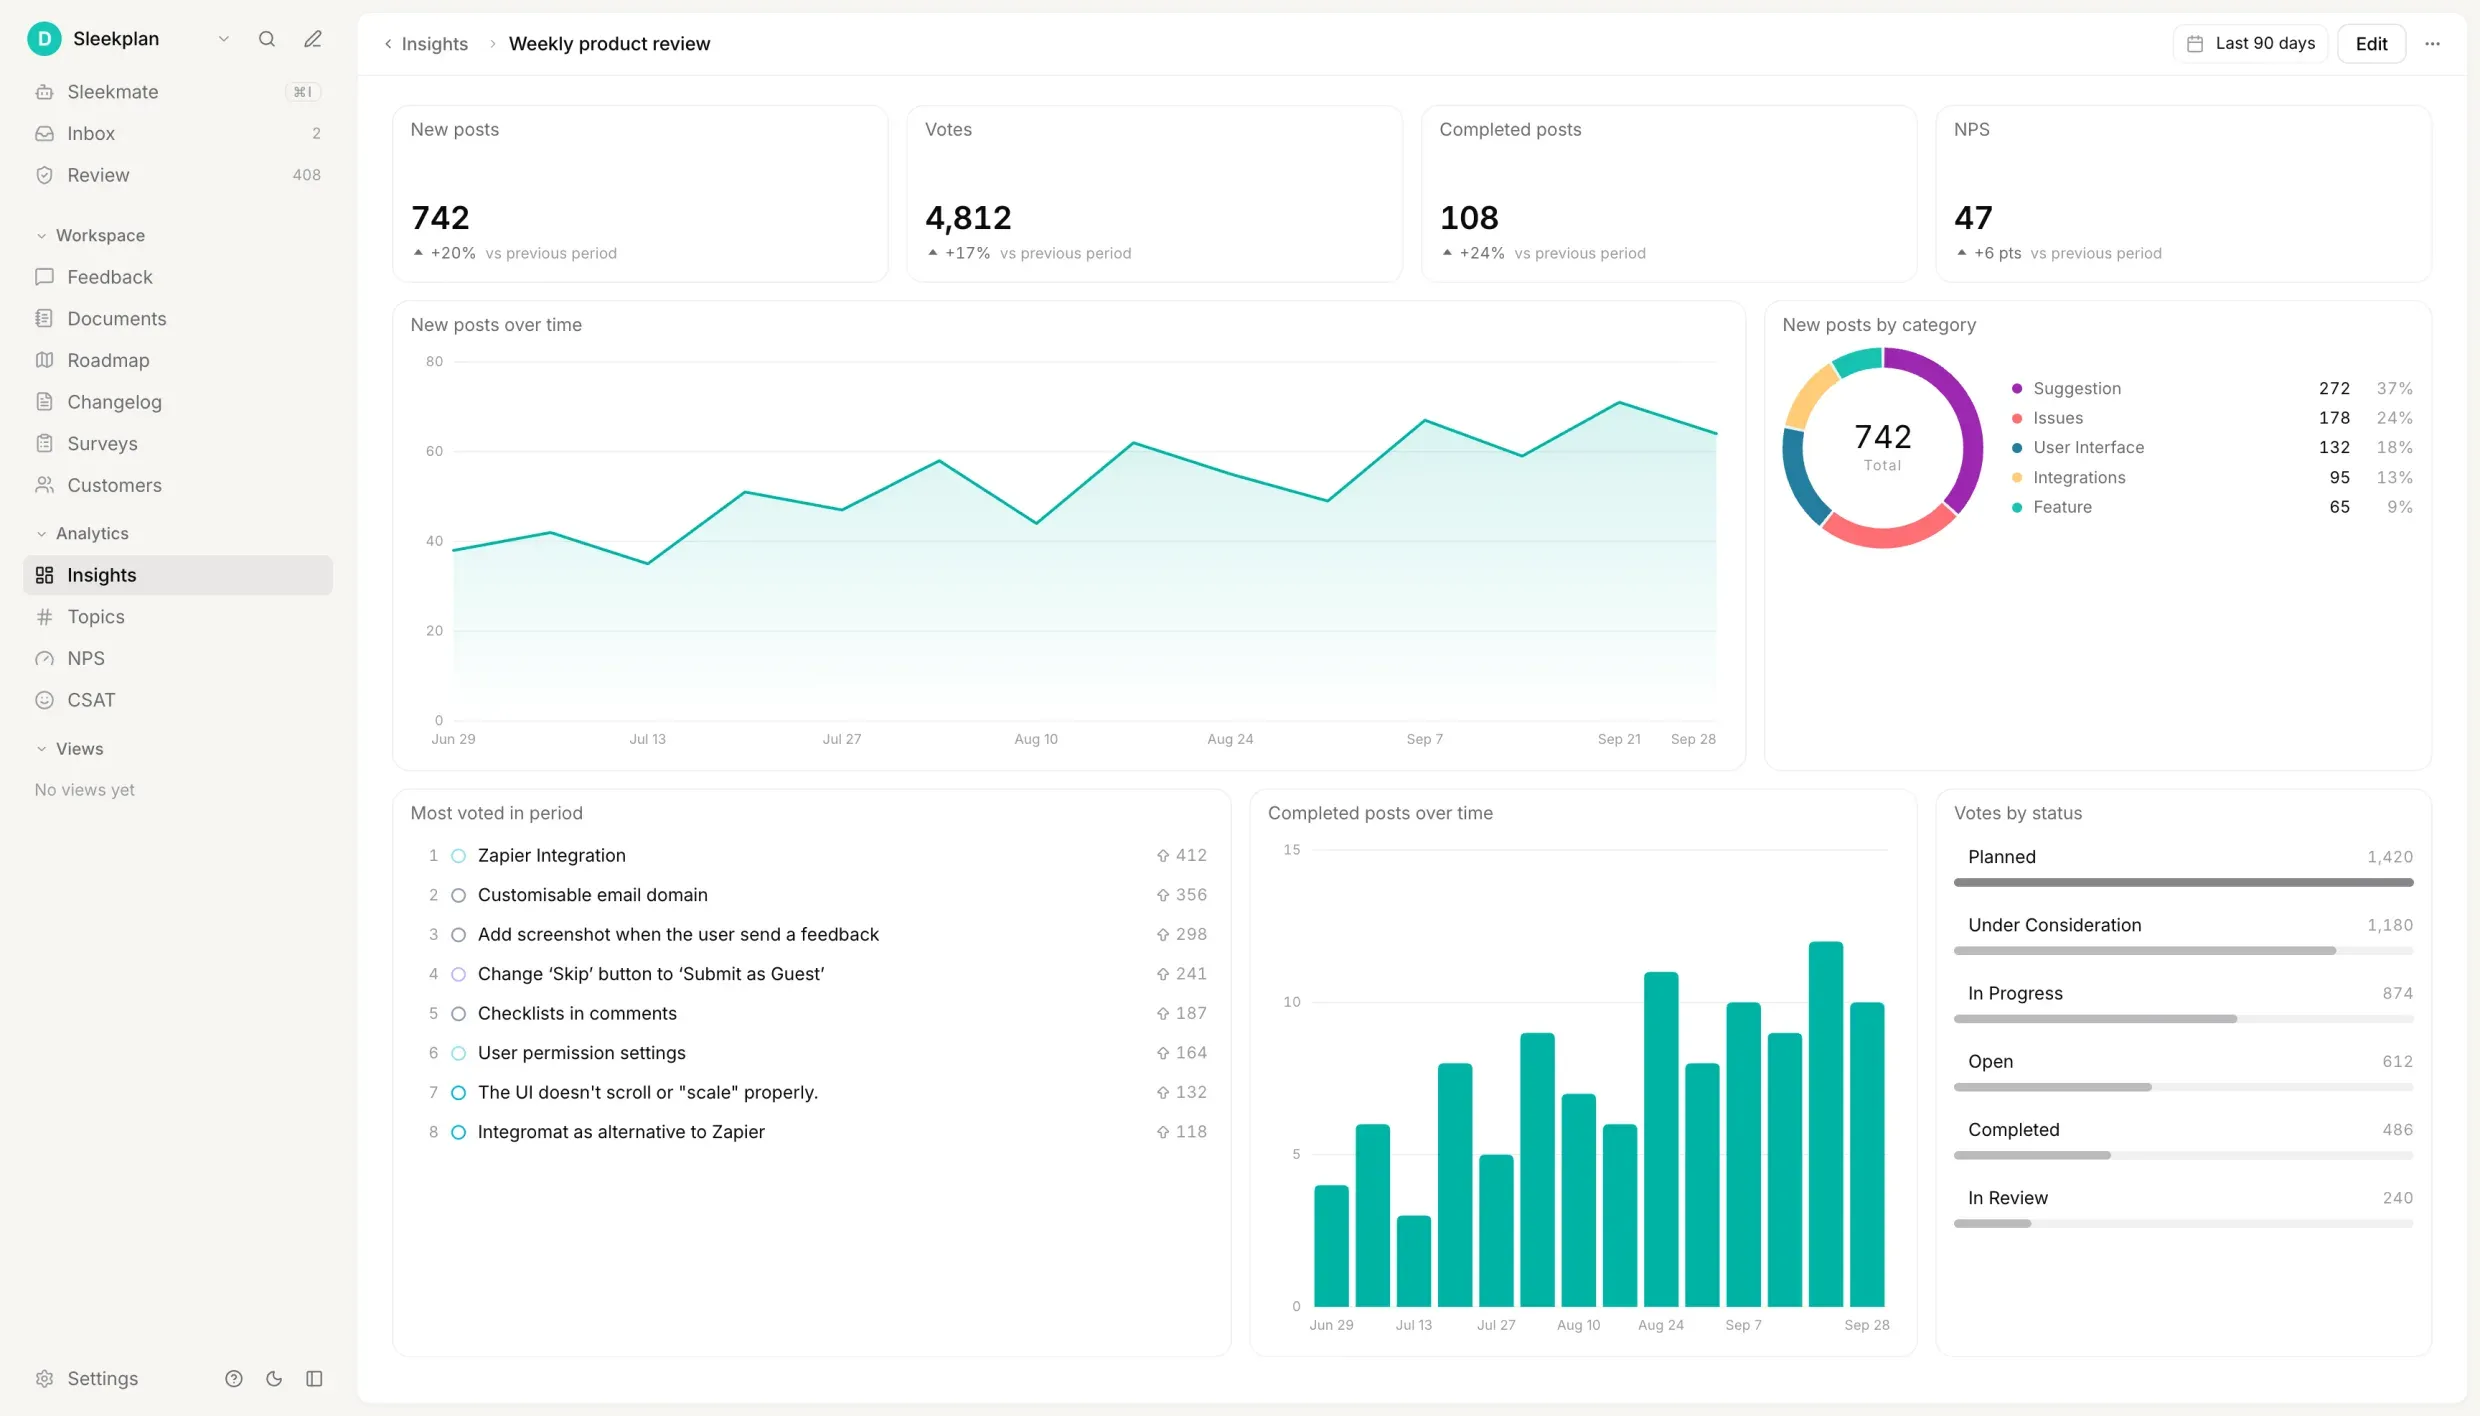
A Sleekplan Insights dashboard for the weekly product review: new posts, votes, completed posts and NPS compared with the previous period, a weekly chart of new posts, posts by category, the most voted requests, completed posts per week and votes by status
Build a dashboard

Pick a metric. Pick a view. That's an insight.

Each tile on a dashboard is one number or one chart. You build it in a dialog, not a query language, and the title writes itself: Votes, broken down by status, becomes "Votes by status".
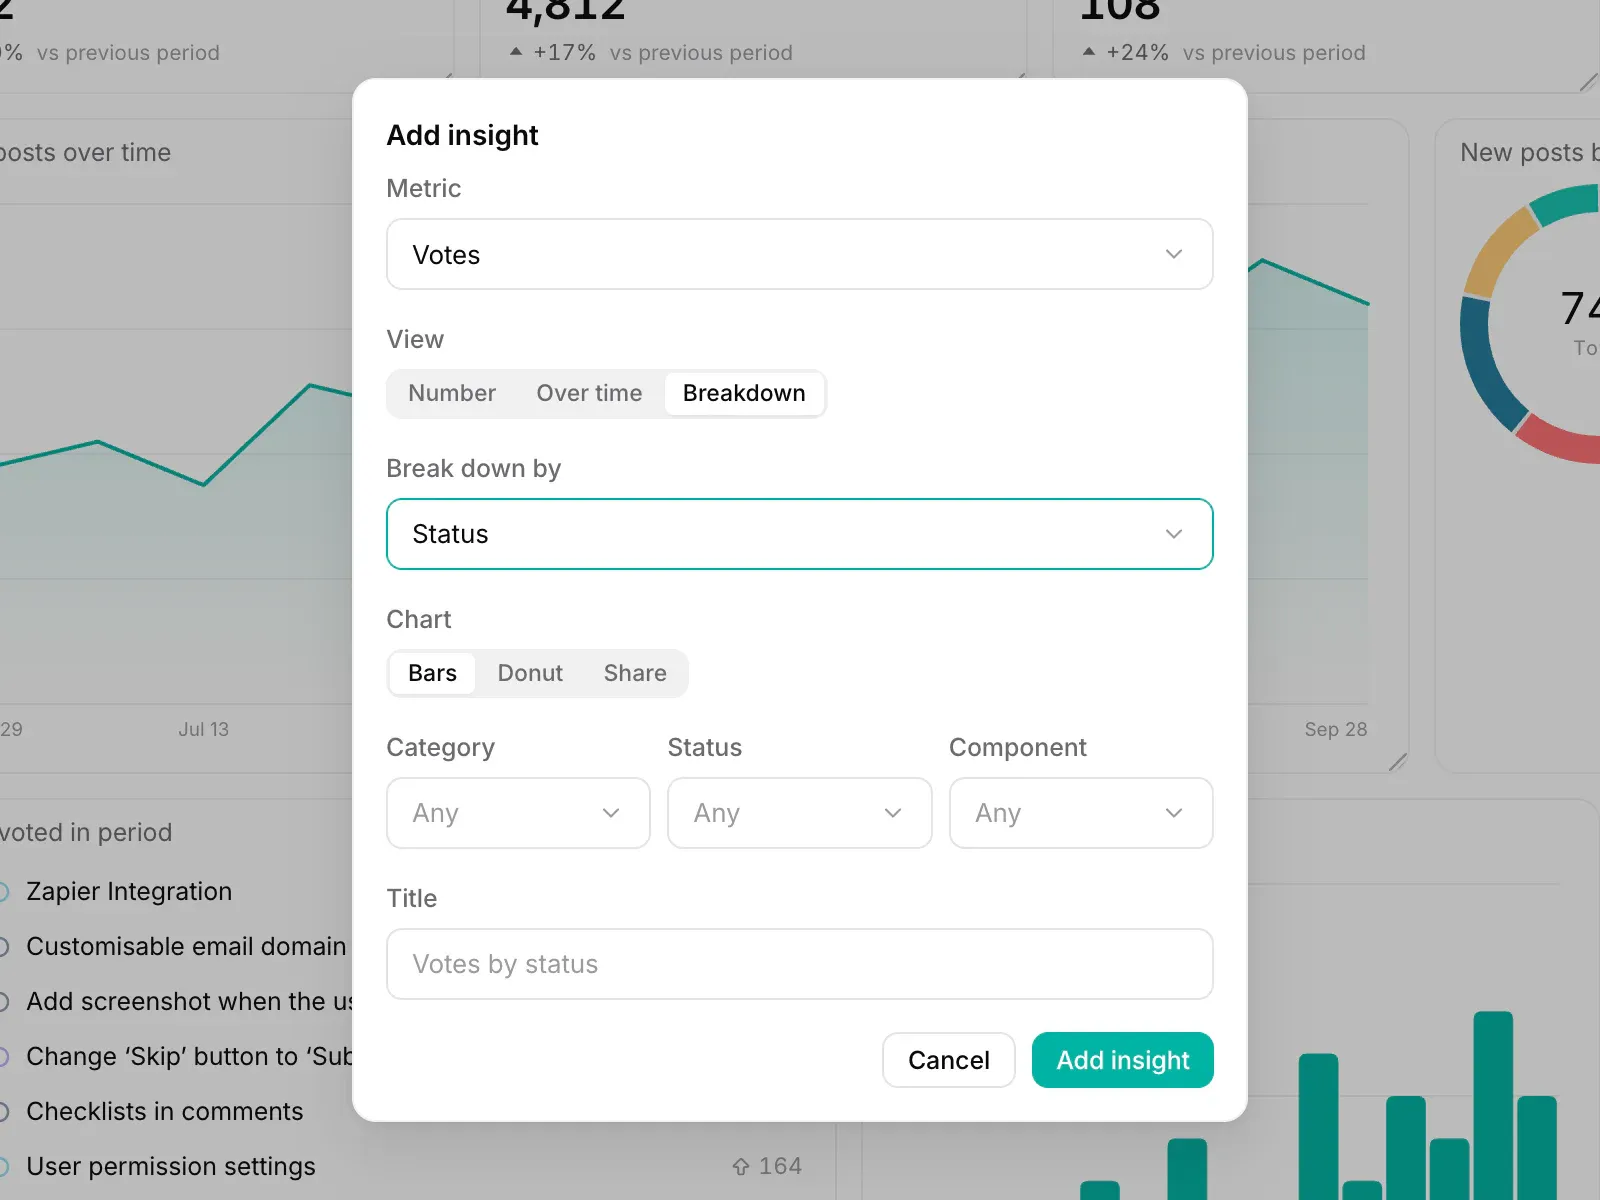
The Add insight dialog in Sleekplan with the Votes metric, the Breakdown view broken down by Status, the Bars chart selected, and the generated title Votes by status
Adding "Votes by status" to a dashboard in edit mode.
  1. 01Pick a metric

    Twenty-two to choose from, from New posts and Votes to Time to first response and NPS. One your plan doesn't include is marked, not hidden.

  2. 02Choose a view

    One number compared with the previous period, a chart over time by day, week or month, or a breakdown by category, status or component.

  3. 03Pick the chart

    Line or columns over time. Bars, donut or a single share bar for a breakdown. Top posts is always a list that links to each post.

  4. 04Save it for everyone

    Edit mode is a draft. Add, move and resize freely, then click Done and everyone who can see the dashboard sees the change. Cancel, and nothing did.

Metrics

Twenty-two metrics. From first vote to "it shipped".

Every metric reads data Sleekplan already has: your posts, votes, replies, changelog, popups and surveys. Nothing to connect, nothing to export. Breakdowns use your own categories, statuses and colours.

Feedback

How much comes in, and what ships?

New posts
Posts created in the date range
Votes
Upvotes cast, with merged posts left out
Completed posts
Posts moved to Completed, each counted once
Time to complete
Median days from a post's creation to Completed
Top posts
The most voted posts, in the period or of all time

Conversation

How fast does the team answer?

Comments
Public comments, split by team, customers or AI
Time to first response
Median time to the team's first public reply or status change
Unanswered posts
Customer posts with no team response yet
Status changes
Public status changes, by the status posts moved to

Closing the loop

Did the people who asked find out?

Voters of completed posts
Customers who upvoted a post before it shipped
Voters told it shipped
The share of those voters who were notified
Changelog updates
Changelog entries published
Changelog views
Views of individual changelog entries
Emails sent
Emails sent on your behalf, by type

In-app messages

Who saw the popup, and what did they do?

Popups delivered
Times a popup was shown to a signed-in visitor, by outcome
People reached by popups
Distinct signed-in visitors who saw one
Popup response rate
The share of deliveries with a completed response
Announcements delivered
Times an in-app announcement was shown to a signed-in visitor
Announcement views
Views of announcements, anonymous visitors included

Traffic and satisfaction

Is anyone looking, and are they happy?

Page views
Views of your widget and public portal, by page
NPS
Net Promoter Score, split into promoters, passives and detractors
CSAT
Average satisfaction rating from 1 to 5, by reaction

NPS, CSAT and the popup metrics need a plan that includes them. Every other metric works on every plan that can build a dashboard.

Capabilities

Built for the weekly review. No analyst required.

Overview template
One click fills a new dashboard with eight insights built on feedback and page views.
12-column grid
Drag an insight to move it, pull its corner to resize. A taller chart shows more rows.
Against last period
Every number shows its change against the same length of time just before.
Your own date range
Nine presets or any start and end date. Teammates keep their own.
Dashboard filters
Narrow every insight to one category, status or component at once.
Shared with the team
Everyone opens the same page and sees the same numbers. Nobody rebuilds the report.
Private dashboards
Keep one to yourself. Not even an Owner or Admin finds it in the list.
Readable on every plan
Anyone on the team can read shared dashboards. Building them needs Business or above.
Fresh in five minutes
New posts, votes and replies reach the numbers within five minutes.
Click through to the post
Hover a chart for exact values. Click a post in a top list to open it.
25 dashboards, 24 insights
One for the weekly review, one for support, one for the launch.
Three years back
A date range can span up to 1,100 days. Long charts switch to weekly or monthly points.
Get started in 4 minutes

Your roadmap,
on autopilot.

Free for 30 days. No card, no sales call. Cancel anytime.