> ## Documentation Index
> Fetch the complete documentation index at: https://sleekplan.com/llms.txt
> Use this file to discover all available pages before exploring further.
# Add and arrange insights
> Edit an Insights dashboard: add numbers and charts, choose how each one is shown, drag and resize them on the grid, and filter the whole dashboard.
You change a dashboard in **edit mode**. Everything you do there is a draft: you can add, change, move, and remove insights freely, and nothing is saved until you click **Done**. **Cancel** throws the draft away.
If you don't have a dashboard yet, [create one](/help/insights#create-a-dashboard) first.
Editing dashboards needs the **Business** plan or above and the **Owner** or **Admin** role. Members can read shared dashboards but can't change them. See [Insights dashboards](/help/insights).
## Start editing
Open the dashboard from [**Insights**](https://app.sleekplan.com/insights) and click **Edit** in the top right. The header now shows the filter button, **Add insight**, **Cancel**, and **Done**. On each insight, a **⋯** menu appears when you hover over it, and a resize handle sits in its bottom-right corner.
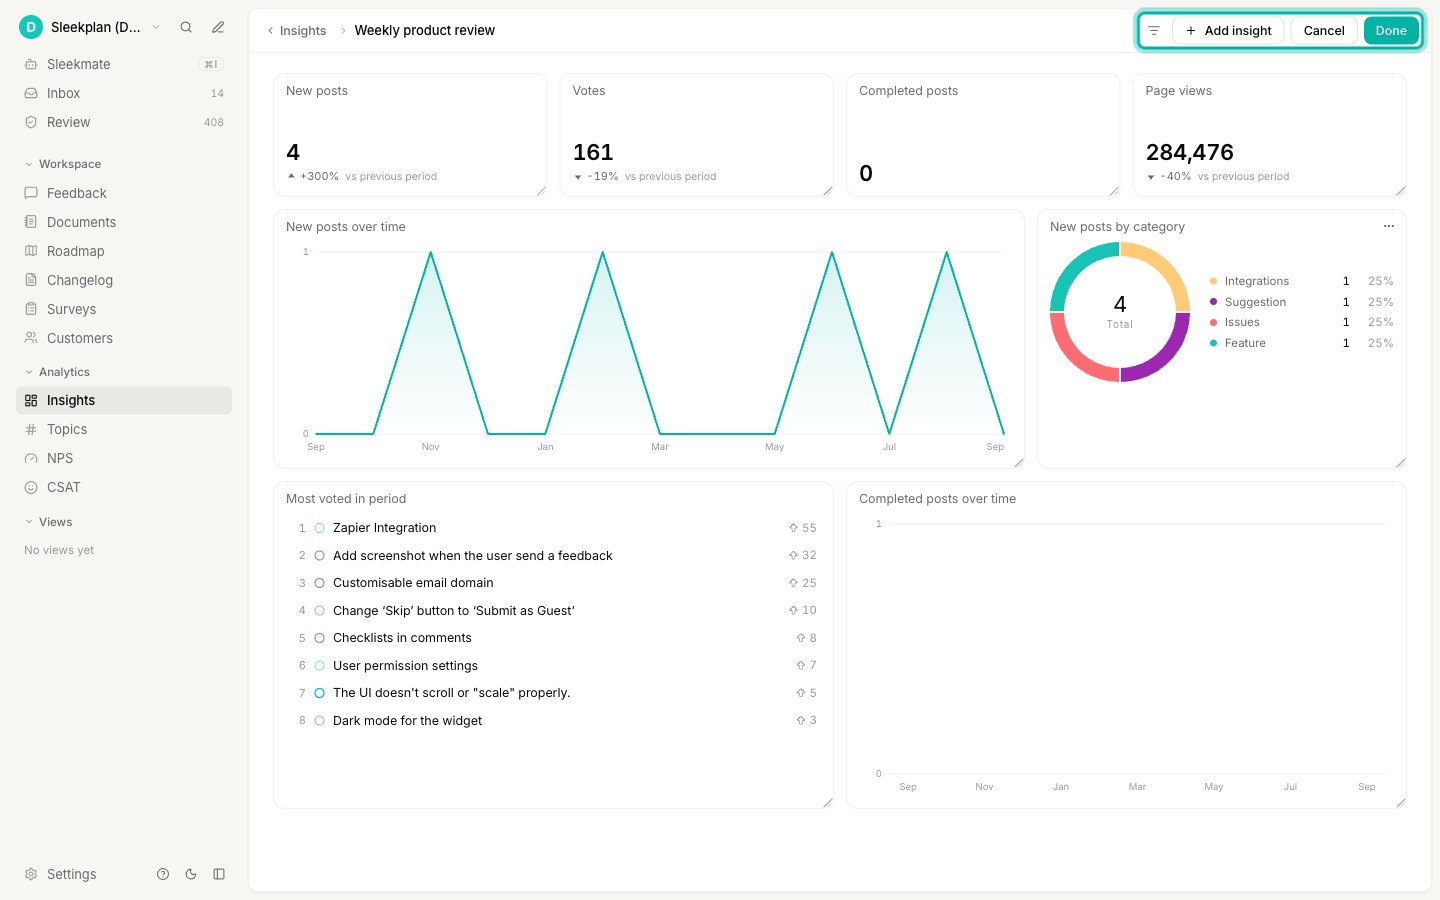 On an empty dashboard you can also click **Add insight** in the middle of the page. That starts edit mode for you.
## Add an insight
Click **Add insight** in the header.
Choose what to measure: **New posts**, **Votes**, **Completed posts**, **Time to complete**, **Top posts**, **Page views**, **NPS**, or **CSAT**. A metric your plan doesn't include is marked **· upgrade**. What each metric counts is explained in [Metrics and charts](/help/insights/metrics).
On an empty dashboard you can also click **Add insight** in the middle of the page. That starts edit mode for you.
## Add an insight
Click **Add insight** in the header.
Choose what to measure: **New posts**, **Votes**, **Completed posts**, **Time to complete**, **Top posts**, **Page views**, **NPS**, or **CSAT**. A metric your plan doesn't include is marked **· upgrade**. What each metric counts is explained in [Metrics and charts](/help/insights/metrics).
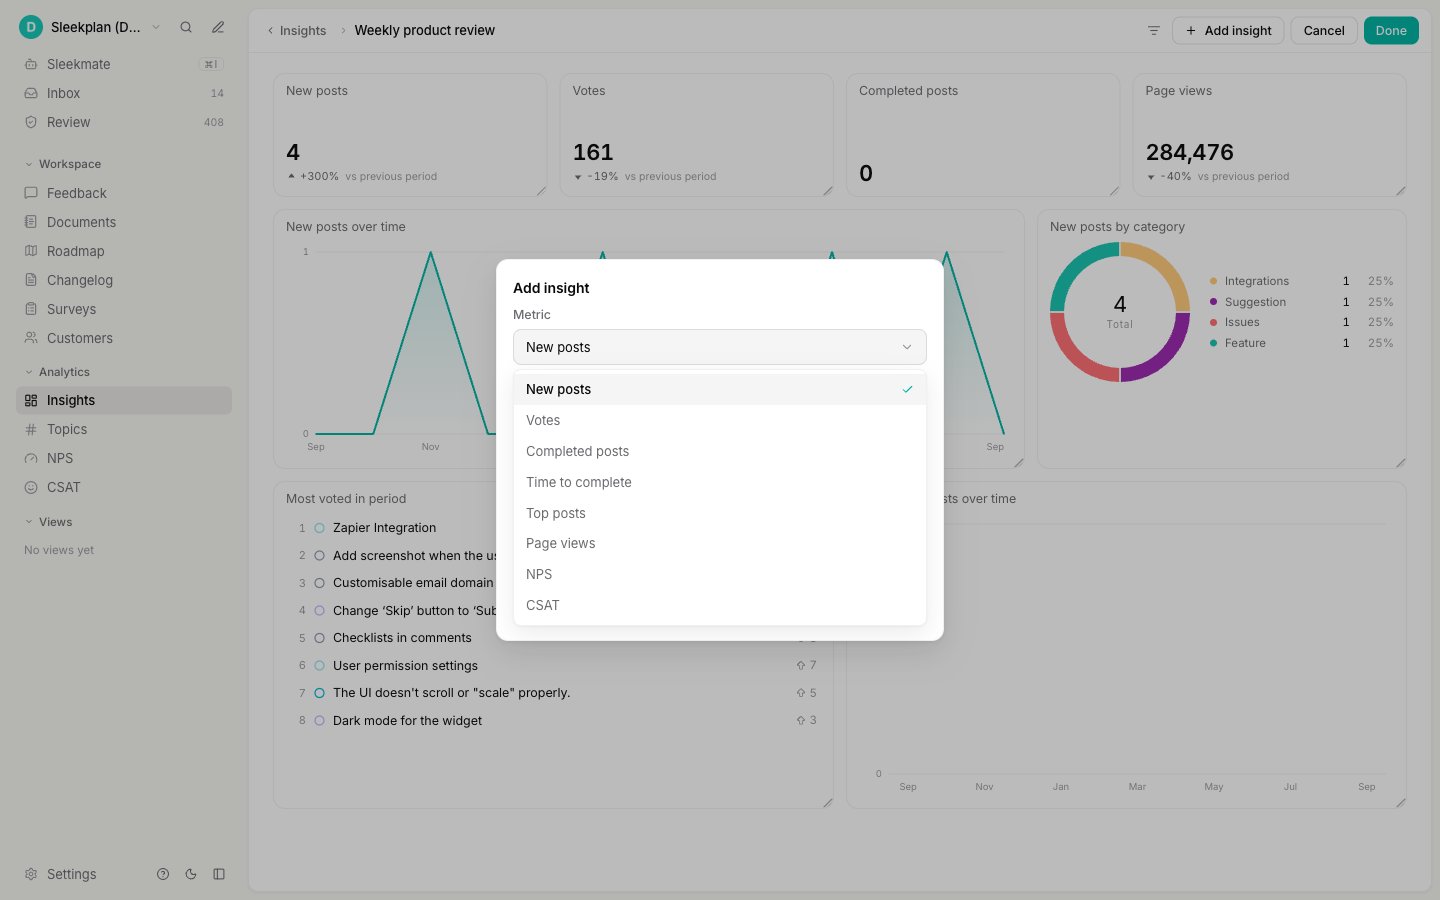 Under **View**, choose how to look at the metric:
* **Number**: one total for the date range, compared with the previous period.
* **Over time**: a chart with one point per day, week, or month.
* **Breakdown**: the total split into parts, for example by category or status.
You only see the views the metric supports. **Top posts** has no views: it's always a list, and you choose **Votes** (**In period** or **All time**) and how many posts to **Show** (5 to 25) instead.
The next fields depend on the view:
* **Over time**: pick an **Interval**: **Auto**, **Day**, **Week**, or **Month**. **Auto** picks one that suits the date range.
* **Breakdown**: pick what to **Break down by**, for example **Status**.
* **Chart**: pick how to draw it. **Over time** offers **Line** and **Columns**. **Breakdown** offers **Bars**, **Donut**, and **Share**.
Under **View**, choose how to look at the metric:
* **Number**: one total for the date range, compared with the previous period.
* **Over time**: a chart with one point per day, week, or month.
* **Breakdown**: the total split into parts, for example by category or status.
You only see the views the metric supports. **Top posts** has no views: it's always a list, and you choose **Votes** (**In period** or **All time**) and how many posts to **Show** (5 to 25) instead.
The next fields depend on the view:
* **Over time**: pick an **Interval**: **Auto**, **Day**, **Week**, or **Month**. **Auto** picks one that suits the date range.
* **Breakdown**: pick what to **Break down by**, for example **Status**.
* **Chart**: pick how to draw it. **Over time** offers **Line** and **Columns**. **Breakdown** offers **Bars**, **Donut**, and **Share**.
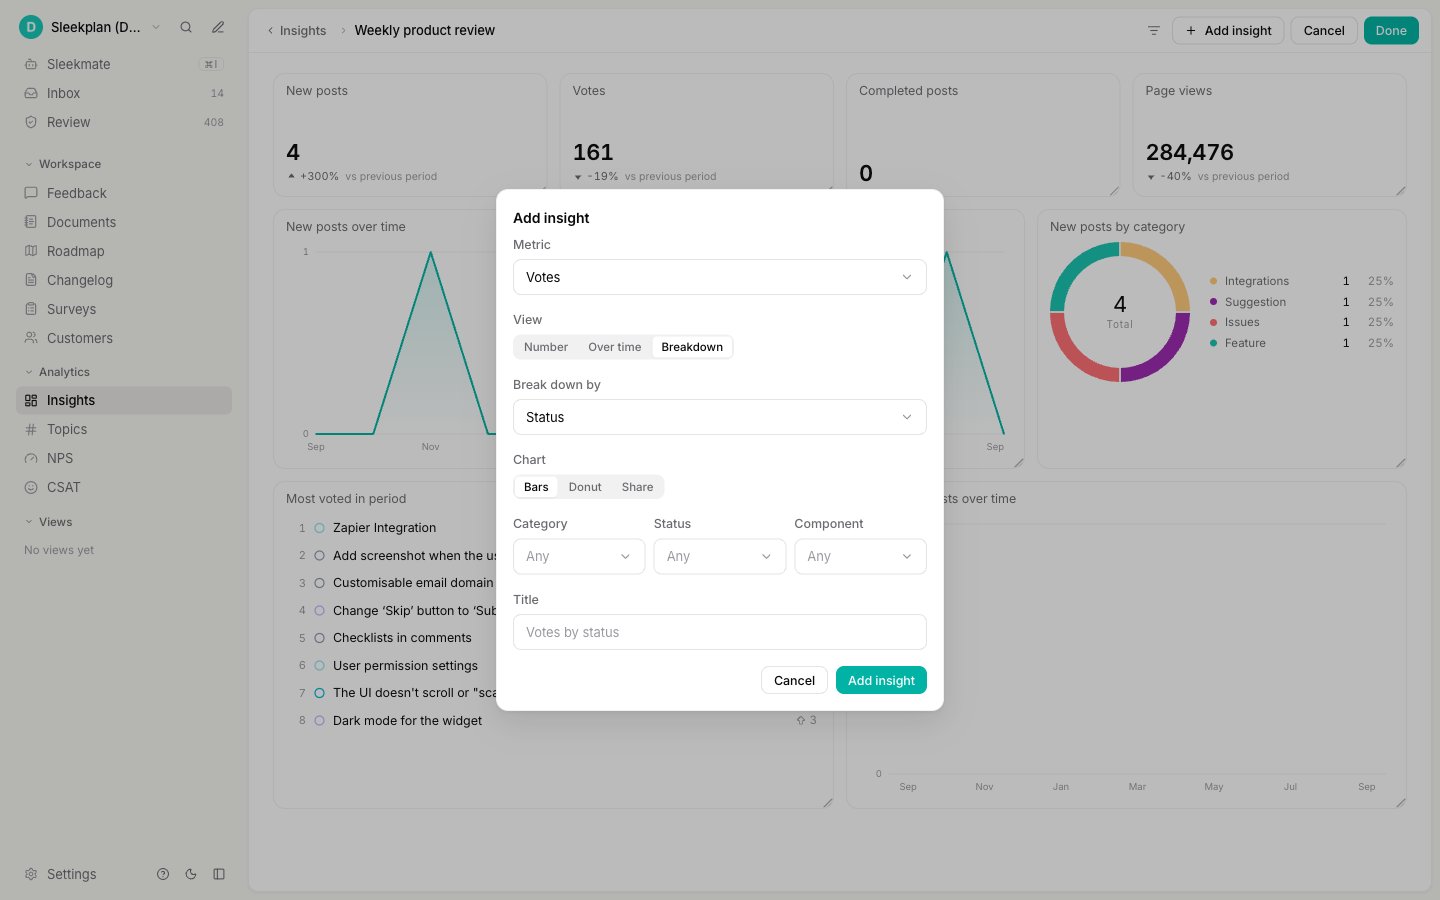 Use **Category**, **Status**, and **Component** to count only matching posts, for example only bugs. Leave them on **Any** to count everything. A metric only shows the filters it supports.
Leave **Title** empty to use the generated title shown in the field, such as "Votes by status", or type your own.
Click **Add insight**. The new insight goes into the first free space on the dashboard that fits it. Move it wherever you like (see below).
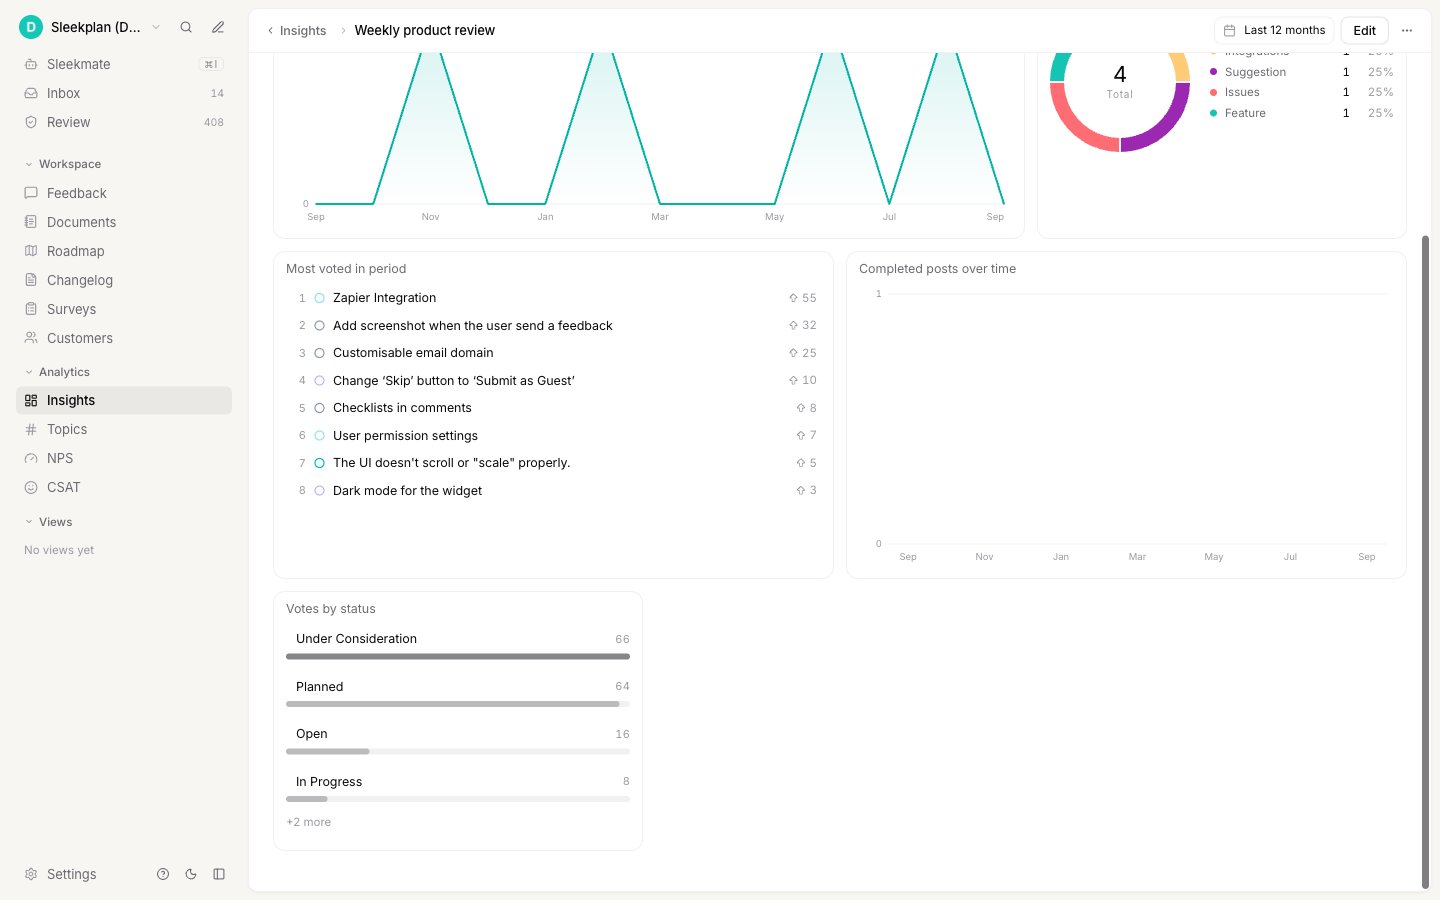
Click **Done** in the header. The dashboard is saved, and everyone who can see it sees the new insight.
Use **Category**, **Status**, and **Component** to count only matching posts, for example only bugs. Leave them on **Any** to count everything. A metric only shows the filters it supports.
Leave **Title** empty to use the generated title shown in the field, such as "Votes by status", or type your own.
Click **Add insight**. The new insight goes into the first free space on the dashboard that fits it. Move it wherever you like (see below).
Click **Done** in the header. The dashboard is saved, and everyone who can see it sees the new insight.
 ## Change or remove an insight
In edit mode, hover over the insight and click its **⋯** menu:
* **Edit** opens the same editor with the insight's settings. Change what you need and click **Save**.
* **Remove** takes the insight off the dashboard. The insights below it move up to fill the gap.
## Change or remove an insight
In edit mode, hover over the insight and click its **⋯** menu:
* **Edit** opens the same editor with the insight's settings. Change what you need and click **Save**.
* **Remove** takes the insight off the dashboard. The insights below it move up to fill the gap.
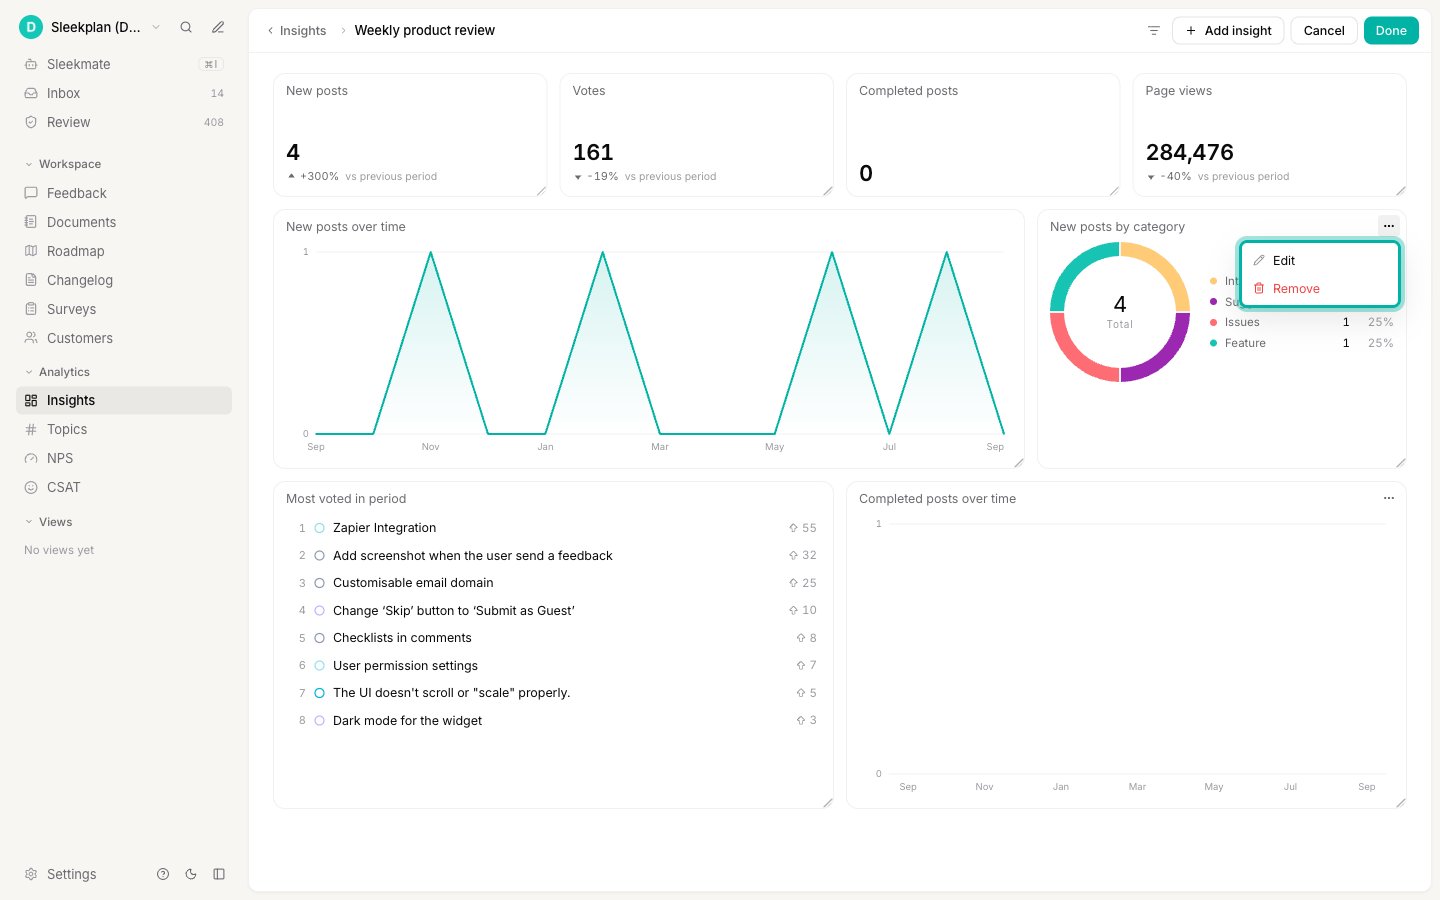 As with every change in edit mode, click **Done** to save it.
## Move and resize insights
A dashboard is a grid of 12 columns, and each insight takes up a rectangle on it.
* **Move**: drag an insight to a new spot. Insights in the way are pushed down, and everything moves up to close any gaps.
* **Resize**: drag the handle in the insight's bottom-right corner. A taller bar chart or list shows more rows. Each chart has a minimum size, so it stays readable.
Moving and resizing only works in edit mode, and not in a narrow window: there, insights are stacked in one column.
## Filter the whole dashboard
Dashboard filters narrow every insight on the dashboard at once, for example to look at one category only.
In edit mode, click the filter button (the funnel icon) to the left of **Add insight**.
Choose **Category**, **Status**, or **Component**, then pick one value. **Component** only appears once your workspace has [components](/help/feedback/components). To remove every filter, choose **Clear all filters**.
As with every change in edit mode, click **Done** to save it.
## Move and resize insights
A dashboard is a grid of 12 columns, and each insight takes up a rectangle on it.
* **Move**: drag an insight to a new spot. Insights in the way are pushed down, and everything moves up to close any gaps.
* **Resize**: drag the handle in the insight's bottom-right corner. A taller bar chart or list shows more rows. Each chart has a minimum size, so it stays readable.
Moving and resizing only works in edit mode, and not in a narrow window: there, insights are stacked in one column.
## Filter the whole dashboard
Dashboard filters narrow every insight on the dashboard at once, for example to look at one category only.
In edit mode, click the filter button (the funnel icon) to the left of **Add insight**.
Choose **Category**, **Status**, or **Component**, then pick one value. **Component** only appears once your workspace has [components](/help/feedback/components). To remove every filter, choose **Clear all filters**.
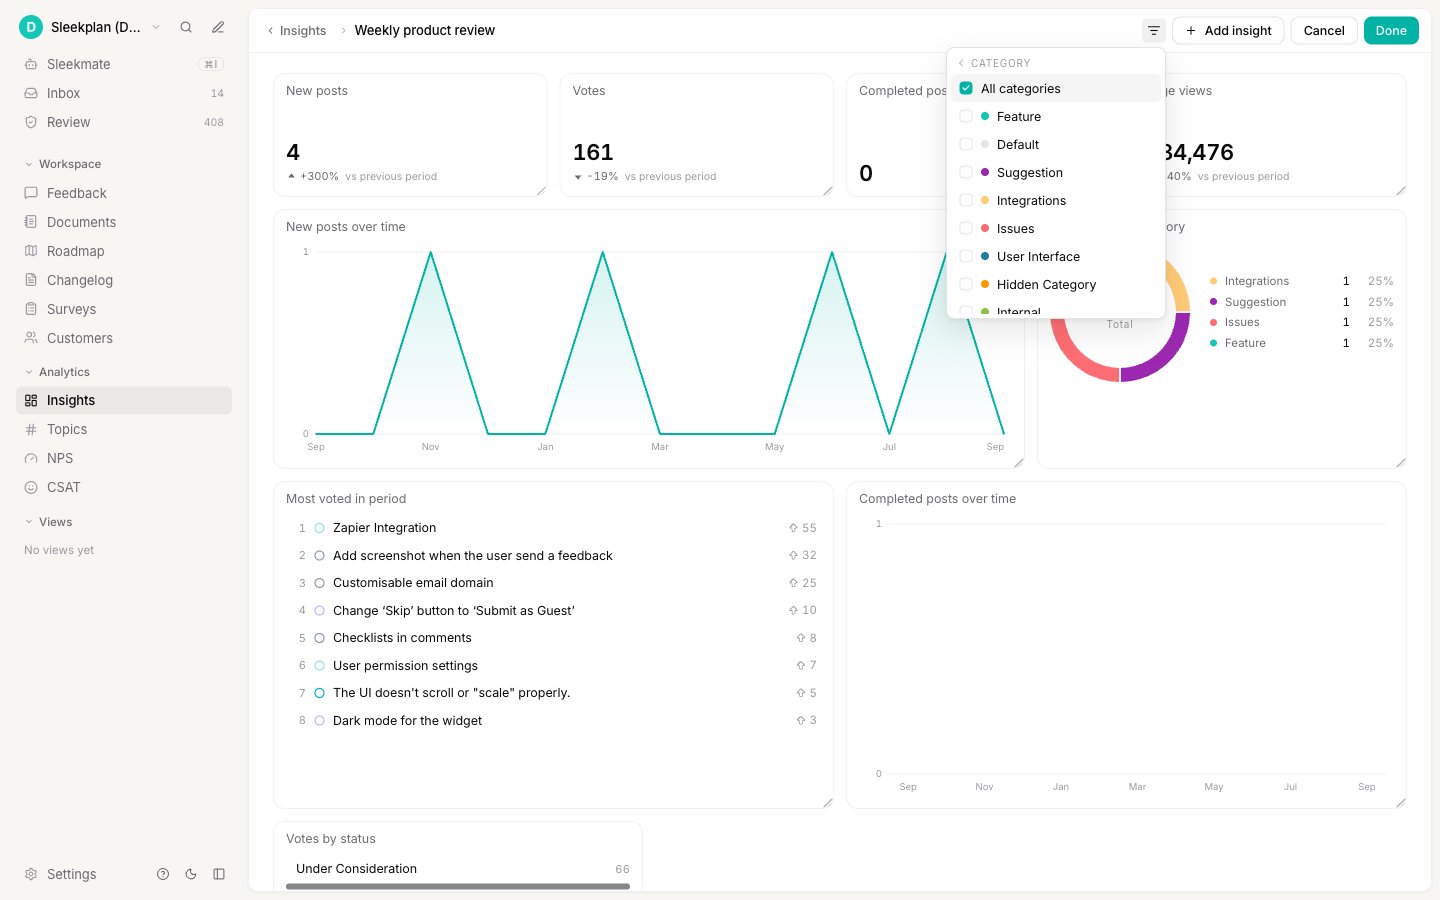 Click **Done**. The active filters now show as tags next to the dashboard's name.
How dashboard filters combine with each insight:
* **The insight's own filter wins.** If the dashboard filters on one category and an insight filters on another, that insight uses its own.
* **Metrics that can't use a filter ignore it.** For example, **Page views**, **NPS**, and **CSAT** can't be filtered by category, status, or component, so they always show all of their data. The filters each metric supports are listed in [Metrics and charts](/help/insights/metrics#metrics-at-a-glance).
* **Filters are saved with the dashboard**, so everyone who opens it sees the filtered numbers. The date range is different: each person picks their own. See [Choose the date range](/help/insights#choose-the-date-range).
## Save or discard your changes
* Click **Done** to save everything you changed in edit mode.
* Click **Cancel** to throw your changes away. The dashboard goes back to how it was.
* If you try to leave the page with unsaved changes, Sleekplan asks whether to **Discard & leave**.
If two people edit the same dashboard at the same time, the last one to click **Done** wins: their version replaces the other person's changes.
## Next steps
What each metric counts and how the numbers are calculated.
Create dashboards, pick the date range, and decide who sees them.
Click **Done**. The active filters now show as tags next to the dashboard's name.
How dashboard filters combine with each insight:
* **The insight's own filter wins.** If the dashboard filters on one category and an insight filters on another, that insight uses its own.
* **Metrics that can't use a filter ignore it.** For example, **Page views**, **NPS**, and **CSAT** can't be filtered by category, status, or component, so they always show all of their data. The filters each metric supports are listed in [Metrics and charts](/help/insights/metrics#metrics-at-a-glance).
* **Filters are saved with the dashboard**, so everyone who opens it sees the filtered numbers. The date range is different: each person picks their own. See [Choose the date range](/help/insights#choose-the-date-range).
## Save or discard your changes
* Click **Done** to save everything you changed in edit mode.
* Click **Cancel** to throw your changes away. The dashboard goes back to how it was.
* If you try to leave the page with unsaved changes, Sleekplan asks whether to **Discard & leave**.
If two people edit the same dashboard at the same time, the last one to click **Done** wins: their version replaces the other person's changes.
## Next steps
What each metric counts and how the numbers are calculated.
Create dashboards, pick the date range, and decide who sees them.